Adding a New Dashboard
The procedure below describes how to add a new dashboard.
| ➢ | To add a new dashboard: |
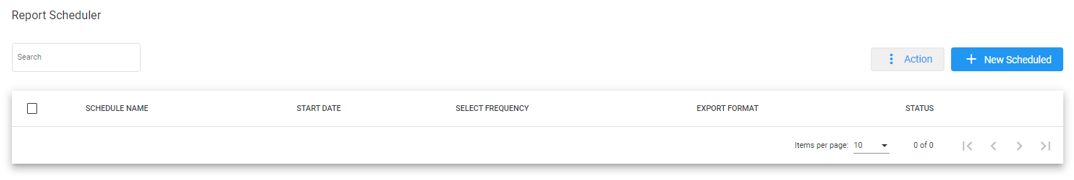
| 1. | Open the Dashboards page (Reports > Call Queue Reports > Real-time Dashboard); the following appears: |
The following is a description of the fields to be entered:
|
Field |
Description |
|---|---|
| Name |
Defines the name of the dashboard. |
| Description | Defines the dashboard description. |
| Dashboard URL | Opens the dashboard in a new window with a permanent link |
| 2. | Click Add New; the following appears: |
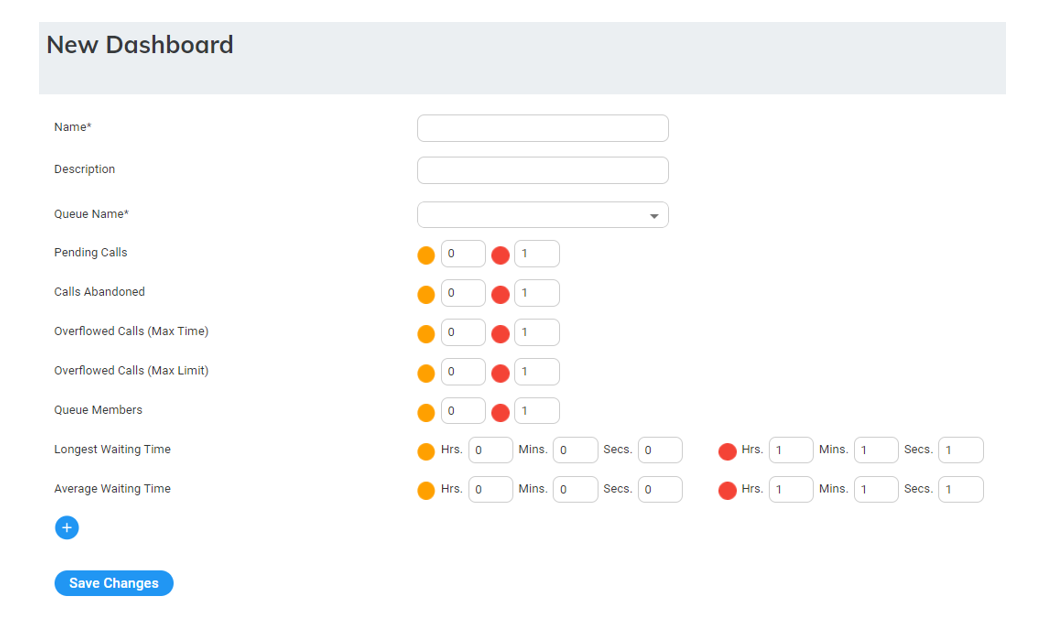
| 3. | The following is a description of the fields to be entered: |
|
Field |
Description |
|---|---|
| Name | Defines the name of the dashboard. |
| Description | Defines the dashboard description. |
| Queue Name | Defines the queue to be monitored from the drop-down list. |
| Pending Calls | Sets the minimum and maximum threshold for calls waiting in the queue. |
| Calls Abandoned | Sets the minimum and maximum threshold for abandoned calls. |
|
Overflowed Calls (Max Time) |
Sets the minimum and maximum threshold for calls that exceeded the Time Limit in the queue level. |
|
Overflowed Calls (Max Limit) |
Sets the minimum and maximum threshold for calls that exceeded the Call Limit in the queue level. |
| Longest Waiting Time | Sets the minimum and maximum threshold for the longest call waiting in the queue (in seconds). |
|
Queue Members |
Sets the minimum and maximum threshold for the longest call waiting in the queue. |
| Longest Waiting Time | Sets the minimum and maximum threshold for the longest waiting time. |
|
Average Waiting Time |
Sets the minimum and maximum threshold for the average waiting time. |
Additional queues can be added to the dashboard by pressing the (+) button.
| ● | The graphic view is generated automatically when up to two queues are configured. If more than two queues are configured, the dashboard displays a table view. The dashboard's data is reset every 24 hours at 00:00. |