Configure Statistics Thresholds Based Alarms
The ARM provides the capability to define threshold-based alarms based on ARM statistics. Every five minutes, the ARM analyzes defined threshold rules and checks whether the defined thresholds were exceeded, starting at x2/x7, the last 5 minutes bucket is analyzed, a bucket being a period of x0-x5/x5-x0 minutes.
| ■ | If a trigger threshold is exceeded and an alarm does not exist, an alarm is issued. |
| ■ | If the threshold is exceeded and an alarm does exist, the alarm count will be increased |
| ■ | If an alarm exists and the value drops below the clear threshold, the alarm is cleared. |
More than one alarm can be issued for the same threshold rule; an alarm is issued per element and statistic type.
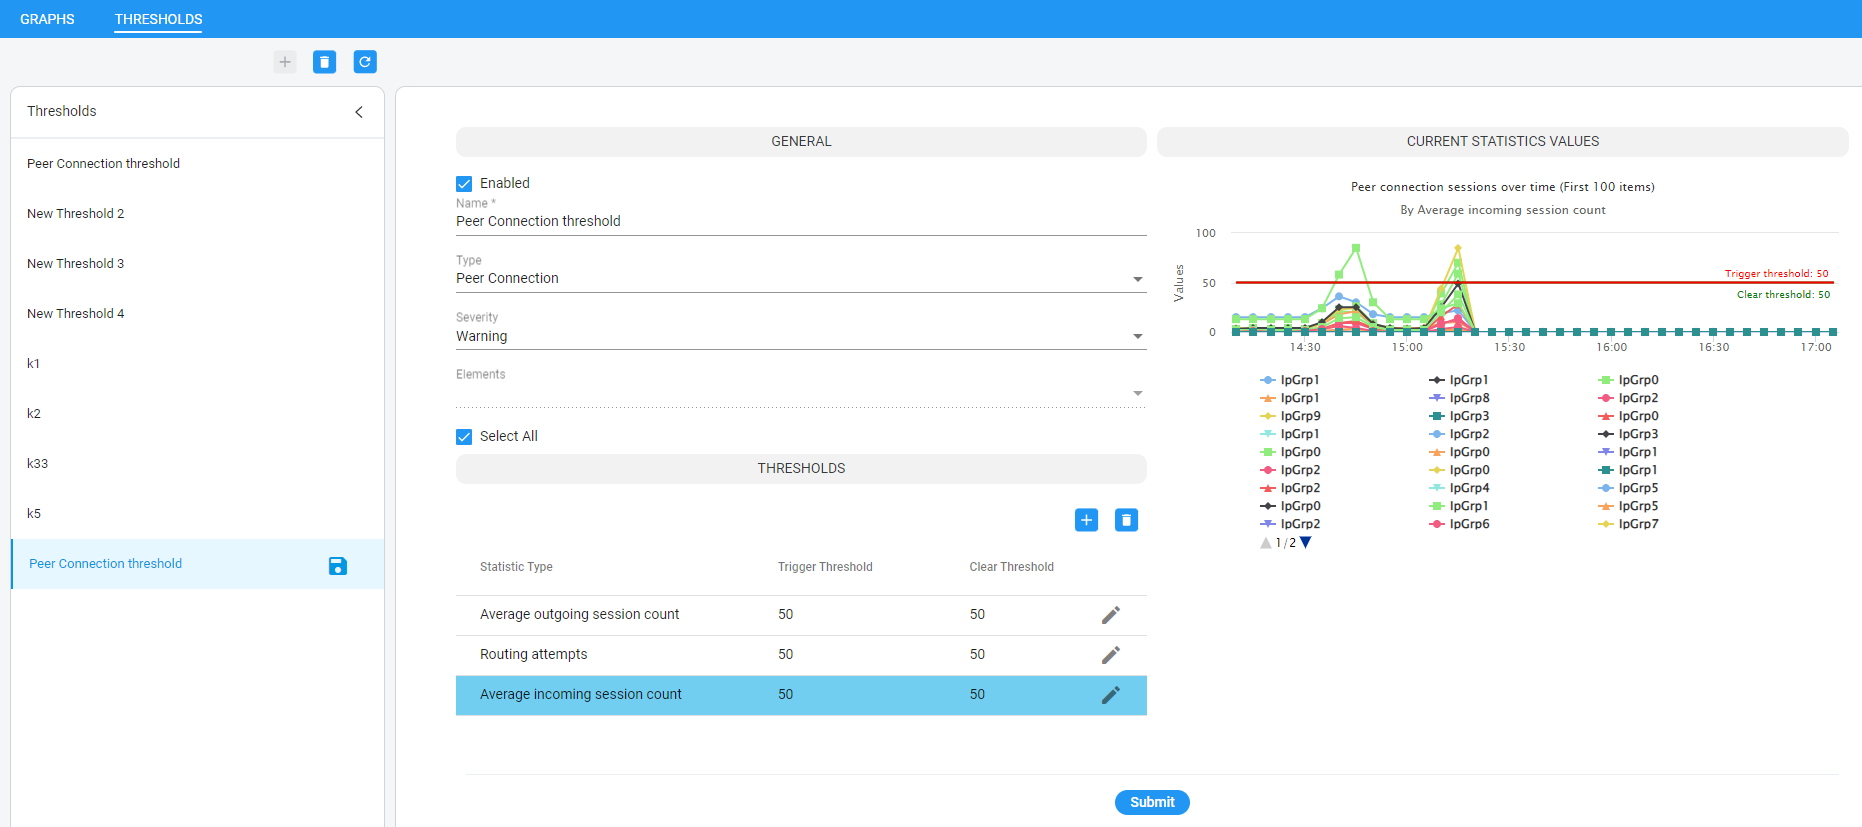
The Statistics page displays a Thresholds tab (Statistics > Thresholds) under which thresholds are configured.
In the page's left pane:
| ■ | add a new threshold by clicking the + icon (see also Add a Statistics Threshold ) |
| ■ | delete an existing threshold by selecting the relevant threshold rule and then clicking the trash icon (see also Delete a Statistics Threshold) |
| ■ | refresh all thresholds by clicking the refresh icon |
| ■ | edit an existing threshold by clicking a specific threshold, editing it, and then clicking the Submit button (see also Edit a Statistics Threshold); if there are alarms related to the threshold, an icon displaying the alarms count is shown. |
# of Alarms per Statistics Threshold
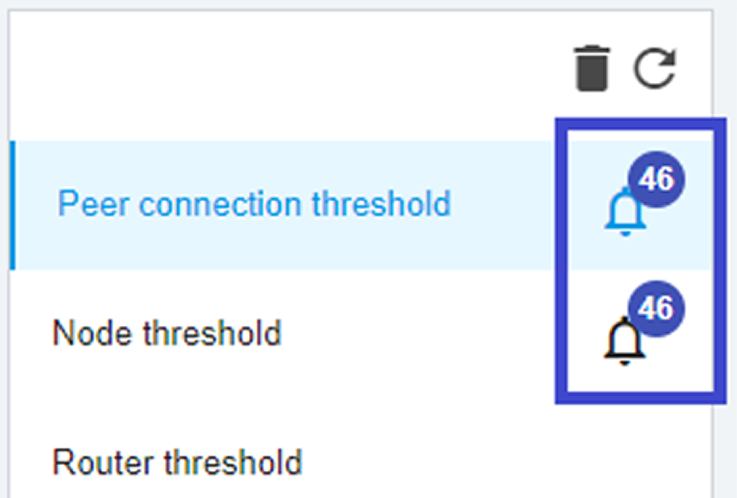
The example in the preceding figure shows that there are currently 46 alarms related to ‘Peer connection threshold’ and ‘Node threshold’ and no alarms related to ‘Router threshold’.
In the page's right pane, view the alarms distribution by statistic types. Under ‘Current statistic values’, the chart for the last three hours is displayed; the Current Statistics Values graph changes accordingly to the selected elements and selected statistic type in the Thresholds section. The chart also shows the trigger threshold and clear threshold. If no elements or statistics are selected, the chart will be empty. In the following figure, the chart represents Peer Connections by average incoming session count for the last three hours.