Aggregated Statistics Trends Report Type
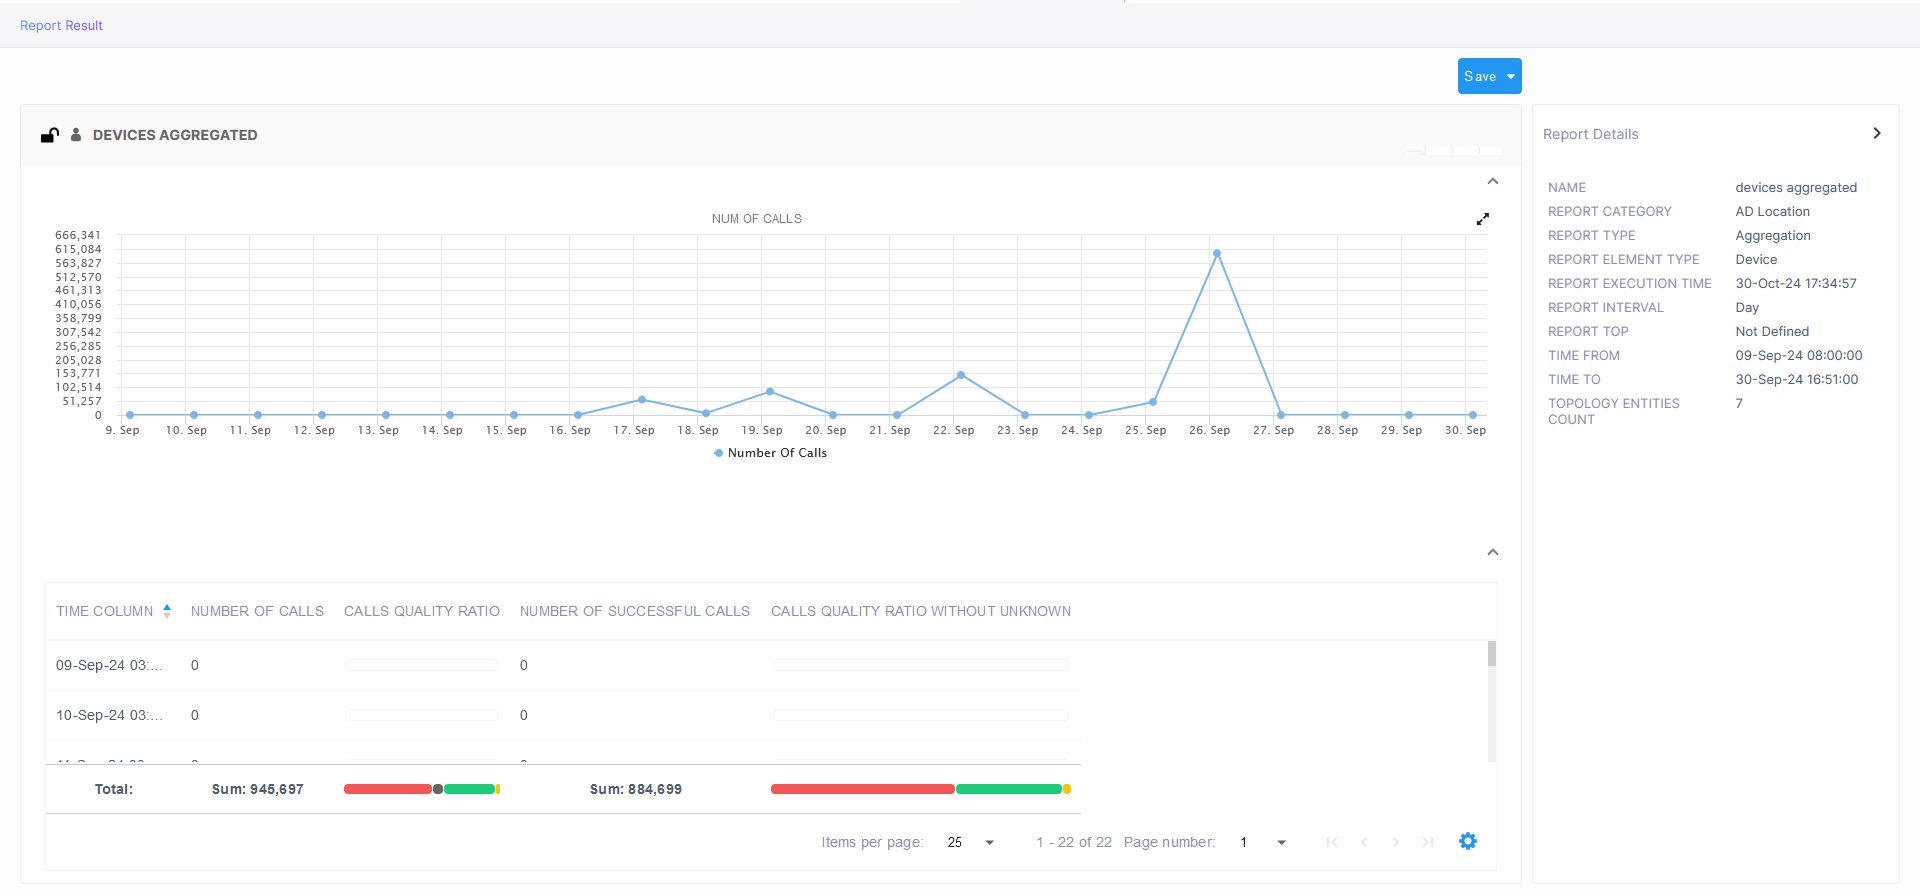
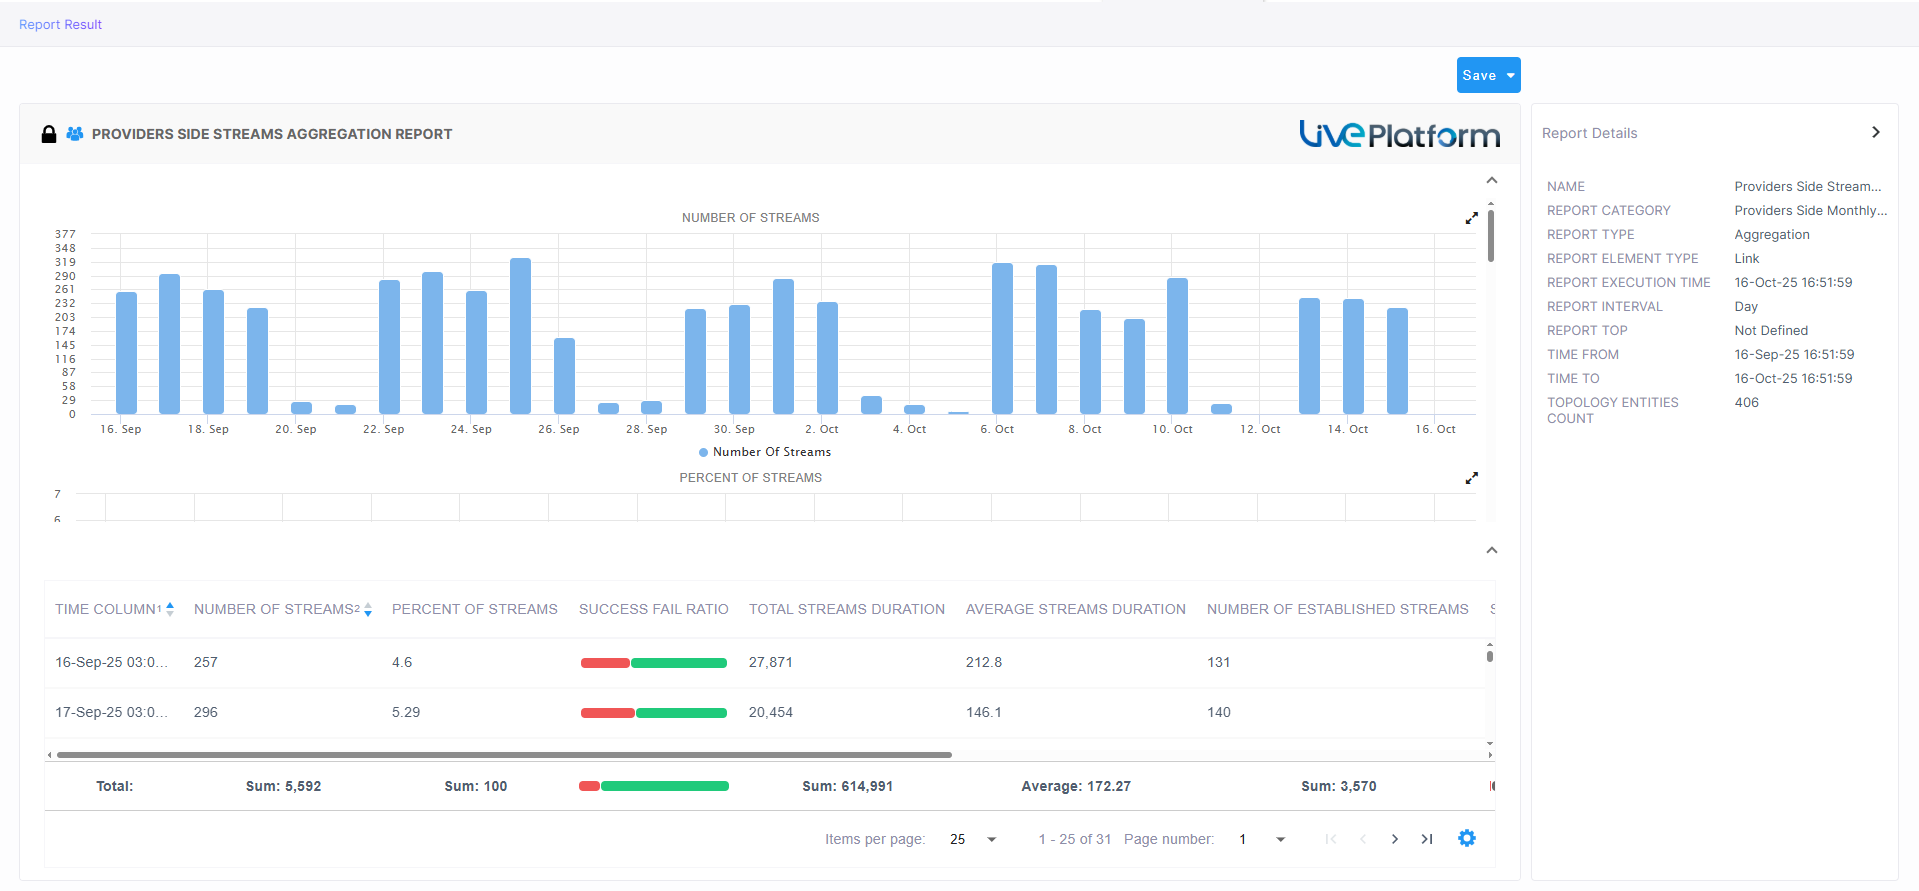
The figures below show example Aggregation reports.
Use the following to get acquainted:
|
■
|
 indicates an administrator-defined report indicates an administrator-defined report |
|
■
|
 indicates the report is public; anyone can view, edit and delete it indicates the report is public; anyone can view, edit and delete it |
|
■
|
 indicates the report is private and only authorized persons can view the report indicates the report is private and only authorized persons can view the report |
|
■
|
 indicates the currently logged in operator is the owner of the report indicates the currently logged in operator is the owner of the report |
|
■
|
'Devices Calls Quality Aggregation Report' indicates the defined name of the report |
|
■
|
The bar chart indicates the number of voice calls made per time period |
|
■
|
The pie chart presents the same information differently; a glance reveals during which time interval (segment) most calls were made; tooltips provide details |
|
■
|
The Report Details pane on the right displays among other details: |
|
●
|
the date and time the report was executed |
|
●
|
the number of entities in the topology |
|
■
|
The lowermost table columns show among other details the time, # of calls, call quality metrics, etc. |