Dashboard overview
The Live Hub Dashboard is the default screen that provides an at-a-glance view of system status and performance metrics, enabling you to monitor and manage your communication services efficiently.
From this dashboard, you can:
-
Monitor key communication and routing statistics in real time.
-
Quickly access SIP connections, bot connections, phone numbers, voice translations services, Teams users, and routing rules.
-
Check for system alarms and network health.
-
View call statistics and analyze performance trends.
-
Click on different sections to navigate directly to their respective configuration pages.
Prerequisites
Access to different sections is based on your User Groups:
-
Configurations: Requires "read" permission for the relevant configuration screen.
-
Alarms : Requires
livehub/alarms/readrole. -
Call statistics: Requires
livehub/statistics/readrole. -
Call success and Voice quality distribution: Requires "read" permission for the Call History screen.
Dashboard
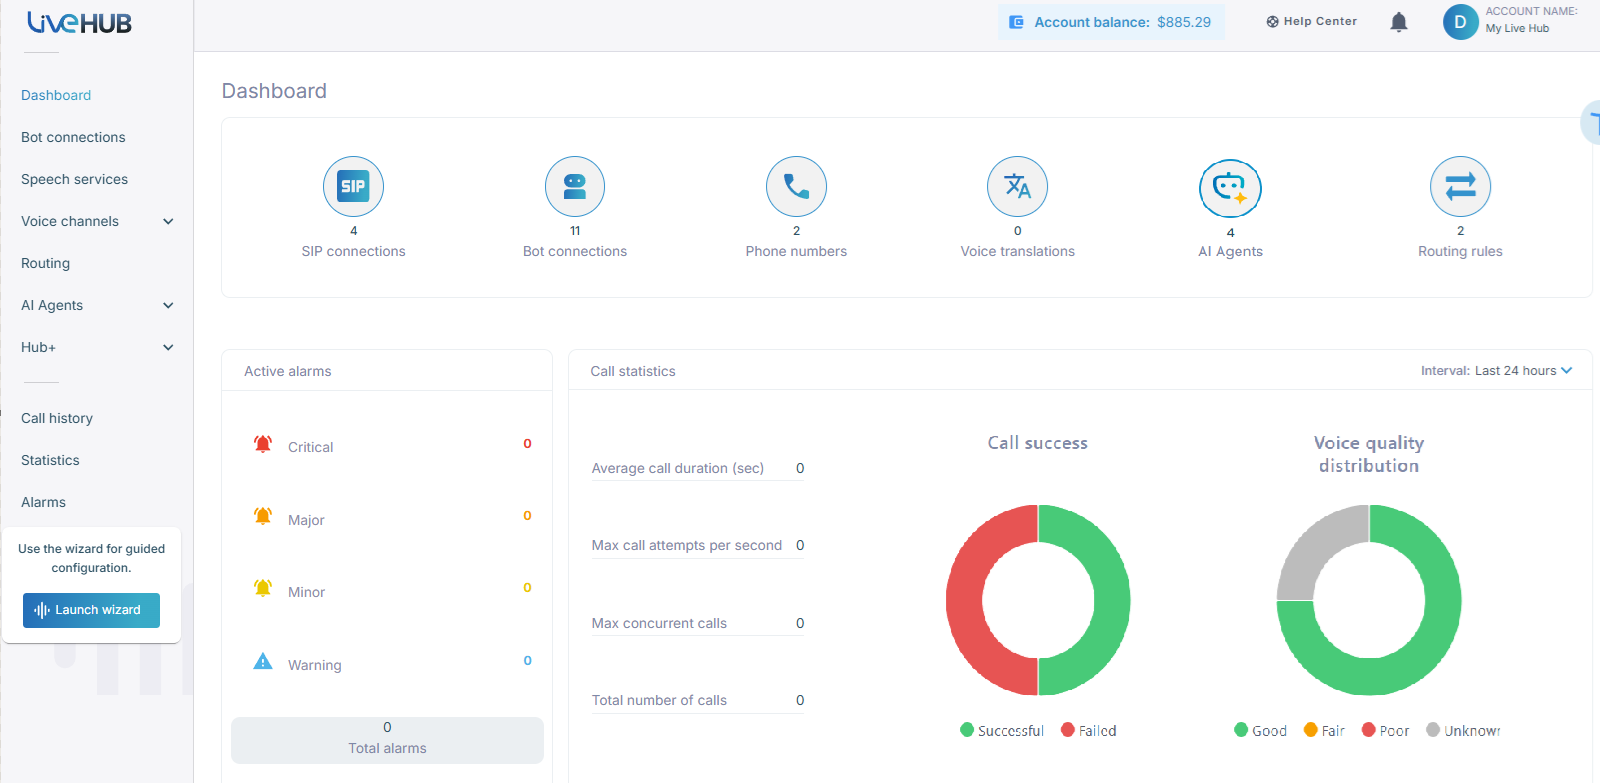
The top section shows a summary of key system components and how many are currently configured. Click on any component to view its configuration in the app.
-
SIP connections: Shows the number of configured SIP connections.
-
Bot connections: Indicates the number of configured bots.
-
Phone numbers: Lists the total number of configured phone numbers.
-
Voice translations: Displays configured voice translation services.
-
AI Agents: Displays the total number of configured AI agents.
-
Routing rules: Indicates the configured routing rules for call handling.
Active alarms
Monitors system alerts and shows the number of active alarms in each category, along with the total count of current alarms. Clicking it will take you to the Alarms page.
Alarms are categorized into:
-
Critical (Red) – Urgent issues needing immediate action.
-
Major (Orange) – Significant issues that require attention.
-
Minor (Yellow) – Non-critical alerts.
-
Warnings (Blue) – Informational alerts that may impact performance.
This helps you monitor system performance and identify issues affecting communication services.
Call statistics
This dashboard displays the following statistics:
-
Average call duration (seconds) – Measures call engagement time.
-
Max call attempts per second – Max calls initiated per second.
-
Max concurrent calls – Shows the maximum number of simultaneous calls.
-
Total number of calls – Total call count.
It displays real-time data for the selected time frame, with a five-minute delay. This represents the last five minutes of aggregated call data, and users can choose from time intervals such as Last 5 minutes, Last hour, and Last 24 hours. For example, if you make a call at 15:39, the call will fall within the 15:35-15:40 time window. However, the data for that call will only be calculated and included in the statistics after 15:40.
-
Shorter time frames (for example, Last 5 minutes) provide more granular insights.
-
Longer time frames (for example, Last 24 hours) help identify trends over time.
This is useful for analyzing call traffic and system capacity.
Call success
Displays call success distribution with:
-
Successful (Green) – Calls that connected successfully. click to call history and see the details
-
Failed (Red) – Calls that either did not establish a connection or abnormally disconnected.
Voice quality distribution
Uses a pie chart to categorize call quality thereby helping assess call performance and troubleshoot potential issues:
-
Good (Green) – High-quality calls.
-
Fair (Yellow) – Moderate quality.
-
Poor (Red) – Low-quality calls.
-
Unknown (Gray) – Calls without sufficient quality data