Performance Monitoring
Performance measurements (performance monitoring) are available for third-party performance monitoring systems through an SNMP interface. These can be polled at scheduled intervals by an external poller or utility in the management server or other off-board systems.
The device provides performance measurements in the form of two types:
|
■
|
Gauges: Gauges represent the current state of activities on the device. Gauges, unlike counters, can decrease in value and like counters, can increase. The value of a gauge is the current value or a snapshot of the current activity on the device at that moment. |
|
■
|
Counters: Counters always increase in value and are cumulative. Counters, unlike gauges, never decrease in value unless the server is reset, which causes the counters to reset to zero (0). |
The device's performance measurements are provided by the following proprietary MIBs that are located under the acPerformance subtree, iso(1).org(3).dod(6).internet(1).private(4).enterprises(1).AudioCodes(5003).acPerformance(10):
|
■
|
acPMMedia: Media-related (voice) monitoring such as RTP and DSP. The MIB includes the following parameters: |
|
●
|
Number of active DSP channels |
|
●
|
Channels used for each coder |
|
●
|
Discarded packets in robust RTP filter |
|
●
|
Media Networking subtree - an array of packet behavior parameters such as delay, jitter, transmitted/received and lost RTP bytes and packets. |
|
●
|
Media Networking Aggregated subtree - displays similar data only for the entire device and includes TDM-IP and IP-IP calls. |
|
●
|
Channel Utilization subtree - parameters regarding channel use by fax, modem, TDM-IP calls, RTP, SRTP, multicast source and modem relay |
|
●
|
Streaming Cache subtree - hit count, miss count and server request count |
|
■
|
acPMControl: Control protocol-related (SIP) monitoring such as connections, commands. |
|
●
|
CP Connection subtree – parameters include connection lifetime/state, counters for commands, retransmissions, active contexts, command success/failure and process time, transaction processing time and call attempts |
|
■
|
acPMAnalog: Analog channels off-hook state (one table only). |
|
■
|
acPMPSTN: PSTN-related monitoring such as channel use and trunk utilization. All statistics in this MIB are per trunk: |
|
●
|
Number of active channels |
|
●
|
Number of channels that are in/out of service and in maintenance |
|
■
|
acPMSystem: General device monitoring: |
|
●
|
Discarded UDP packets due to unknown port |
|
●
|
System Net Utils subtree – transmitted/received bytes/packets, discarded packets |
|
●
|
System Network subtree – DHCP response time/request count and STUN-related statistics |
|
●
|
System Multicast subtree – multicast IP packets received, multicast IP packets conveying UDP payload packets received/rejected, IGMP packets/general-queries/specific-queries received, IGMP membership-report/leave-group sent messages |
|
●
|
System Congestion subtree – congestion state for general resources, DSP resources, IP resources, conference resources |
|
●
|
System NFS subtree – NFS-related parameters |
|
●
|
System MSBR subtree – includes received good/bad octets, received undersized/oversized/discarded packets, received MAC errors, received FSC error packets, transmitted octets/packets/collisions/late-packets |
Performance monitoring MIBs all have an identical, fixed structure, which includes two major subtrees:
|
■
|
Configuration subtree: Allows configuration of general attributes of the MIB and specific attributes of the monitored objects. This subtree includes: |
|
●
|
Reset Total Counters: Resets the "total" (see below) objects in all the MIB’s tables, if they are defined. |
|
●
|
Attributes subtrees: Number of subtrees in which scalars are used to configure high and low thresholds for relevant tables. |
|
■
|
Data subtree: Consists of monitored data and statistics, and includes: |
|
●
|
Time From Start Of Interval object: GETs the time in seconds from the beginning of the current interval. |
|
●
|
Data tables: All have similar structure. Not all possible columns appear in all of them. The specific structure of a table (i.e. what columns are defined) is parameter specific. The only column that always appears is the interval column. The information in each column is a statistical attribute of the parameter being measured. |
The device measures performance at fixed intervals of 15 minutes. The device keeps a record of the last two completed intervals. These intervals are used as a key in the MIB tables in which the performance monitoring results are presented. There are one or two indices in each table. If there are two, the first is a sub-set in the table (e.g., trunk number) and the second (or the single where there is only one) index represents the interval number:
|
■
|
0: Current interval (not completed) |
|
■
|
1: Last completed interval |
|
■
|
2: Second last completed interval |
When the current interval (Interval 0) completes (reaches 15 minutes), Interval 2 is discarded, Interval 1 becomes Interval 2, Interval 0 becomes Interval 1, and a new Interval 0 is created.
|
●
|
The interval’s start time is synchronized with the device’s clock so that the intervals begin on the hour (e.g., 12:00). If you are using NTP, then it is likely that the last interval within the first hour after device startup will be cut short to accommodate for this synchronization. |
|
●
|
Some performance monitoring parameters support a history with more than two intervals. These include conference calls, trunk-test calls and digit-collect requests. |
|
●
|
An attribute whose value is -1 means that the attribute isn’t relevant at that point of time. |
|
●
|
If the device has just started up and the first measuring interval has not elapsed, intervals 1 and 2 are not applicable and their data values are typically displayed as "-1" or as empty cells. |
The following figure shows an example of a monitored parameter, in this case, the number of utilized B-channels in a single trunk:
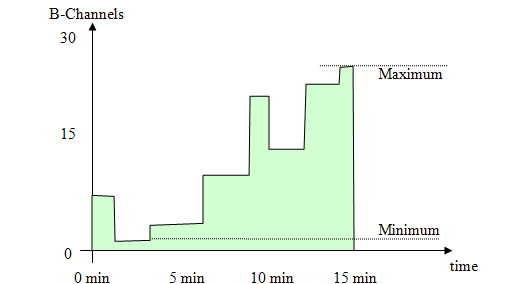
The x-axis is the time within the interval; the y-axis is the number of used channels. The parameter’s value is a gauge. While the interval index is 0 (i.e., current interval), any GET on the parameter value will return a y-axis value at that moment. When the interval is complete (index 1 or 2), the gauge value is no longer relevant and other attributes become relevant such as the average (area in green divided by the interval length in seconds), which is called time-based statistics.
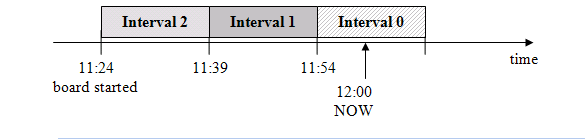
The following figure shows an example of the last three intervals. In this example, the device was powered up at 11:24. The first interval (of 15 minutes) ended at 11:39 and the second interval (of 15 minutes) ended at 11:54. The current interval (Interval 0) has not completed the 15 minutes. Typically, you would want the measured performance of the last completed interval (i.e., Interval 1).
The performance monitoring MIB tables can include the following properties (columns):
|
■
|
Table specific index: This is a table key. |
|
■
|
Interval: Indicates the measured interval (0, 1, or 2), which is a table key. |
|
■
|
Val: Indicates the value of the gauge or counter. This is the snapshot view of the device's current activity. |
|
●
|
Counter: Cumulative value (only increases). |
|
●
|
Gauge: Fluctuates in value (increases and decreases). |
|
■
|
Average: Indicates the average value within the interval. |
|
■
|
Max: Indicates the maximum gauge value during the interval. |
|
■
|
Min: Indicates the minimum gauge value during the interval. |
|
■
|
Volume: Indicates the number of times the gauge or counter was updated (i.e., the volume of change), for example: |
|
●
|
For a trunk utilization element, the volume indicates how many calls were made and released. |
|
●
|
For the Ethernet connection status element, the volume indicates how many network connections and disconnections occurred. |
|
●
|
TimeBelowLowThreshod: Indicates the percent (%) of the interval time for which the gauge was below the low threshold (if defined). |
|
●
|
TimeAboveHighThreshod: Indicates the percent (%) of the interval time for which the gauge was above the high threshold (if defined). |
|
●
|
TimeBetweenThresholds: Indicates the percent (%) of the interval time for which the gauge was between the low and high thresholds (if defined). |
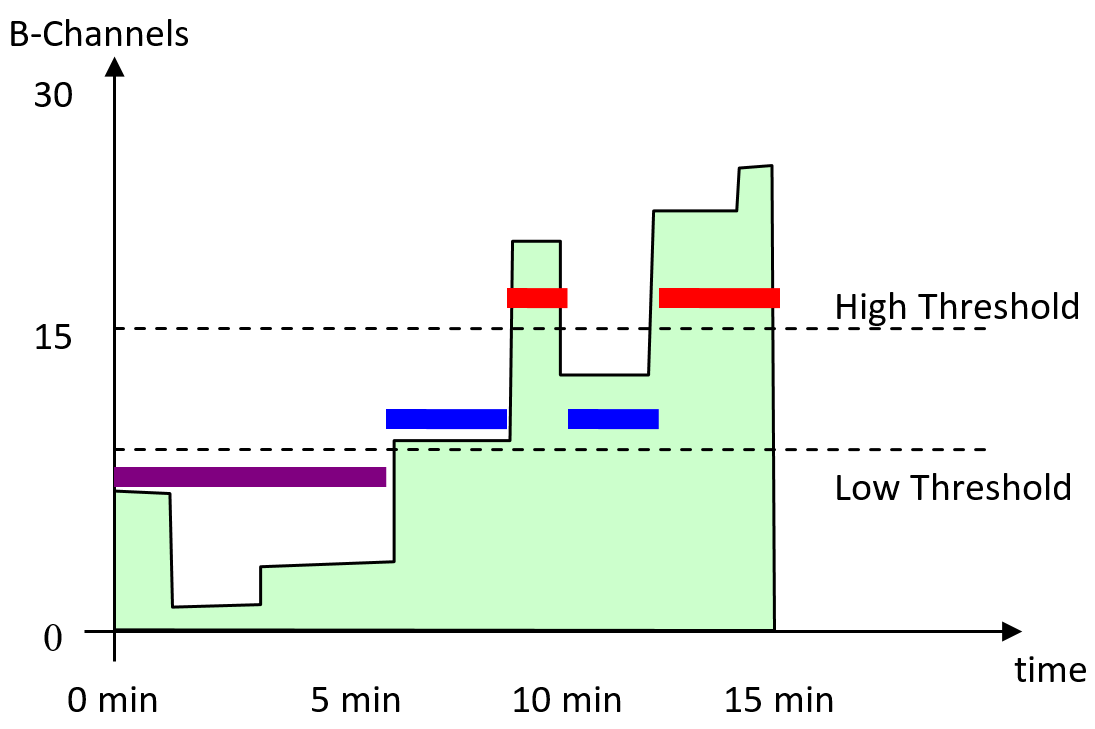
The following figure shows an example of how the device calculates thresholds. The purple bar indicates the time when the element was below the low threshold (about 40% of the interval time), the blue bar indicates the time when the element was between the low and high threshold (about 30%), and the red bar indicates the time when the element was above the high threshold (about 30%).
The following summarizes how to do an SNMP Get operation for performance monitoring:
|
■
|
To perform SNMP Get operations on global performance monitoring (PM) parameters: |
|
●
|
Realtime PMs: Append ".0" to the end of the PM (e.g., acPMSBCAsrVal.0). |
|
◆
|
For the last completed 15-minute interval, append ".1" to the end of the PM (e.g., acPMSBCAsrVal.1).
|
|
◆
|
For the second last completed 15-minute interval (i.e., 30 minutes ago), append ".2" to the end of the PM (e.g., acPMSBCAsrVal.2). |
|
■
|
To perform SNMP Get operations on table PM parameters: |
|
●
|
Realtime PMs: Append to the end of the PM, the table row index of the entity followed by ".0" (e.g., for IP Group #4: acPMSBCIPGroupAsrVal.4.0). |
|
◆
|
For the last completed 15-minute interval, append to the end of the PM, the table row index of the entity followed by ".1" (e.g., for IP Group #4: acPMSBCIPGroupAsrVal.4.1). |
|
◆
|
For the second last completed 15-minute interval (i.e., 30 minutes ago), append to the end of the PM, the table row index of the entity followed by ".2" (e.g., for IP Group #4: acPMSBCIPGroupAsrVal.4.2). |
The SNMP trap event acPerformanceMonitoringThresholdCrossing is sent every time the high or low threshold of a Performance Monitored MIB object is crossed (see Performance Monitoring Threshold-Crossing Trap). The severity field is 'indeterminate' when the crossing is above the threshold and 'cleared' when it returns to below the threshold. The trap's 'source varbind' indicates the object for which the threshold is crossed. To enable this feature, load an ini file to the device with the following parameter setting:
PM_EnableThresholdAlarms = 1
Once enabled, you can change the low and high threshold values from their default values, through ini file by using the following syntax:
PM_<MIB Source Name> = '1,<Low Threshold>,<High Threshold>,15'
where:
|
●
|
<MIB Source Name>: The source name of the MIB (e.g., PM_TrunkUtilization, PM_NetUtilKBytes, and PM_gwIPGroupOutINVITEDialogs) |
|
●
|
<Low Threshold>: Defines the low-threshold value |
|
●
|
<High Threshold>: Defines the high-threshold value |
The value "15" in the syntax is the measuring interval, which is always fixed at 15 minutes.
The following is an example of an ini file that configures the acPMSIPIPGroupOutInviteDialogsTable performance monitoring MIB (OID 1.3.6.1.4.1.5003.10.8.2.52.35) with a low threshold of 10 and a high threshold of 18:
PM_gwIPGroupOutINVITEDialogs = '1,10,18,15'
If you download (save) the device's ini file, it includes all SNMP performance monitoring MIBs whose thresholds (low and/or high) you have changed from default. To apply these same threshold values to other devices, load the file to the other devices.
|
■
|
FullDayAverage: Indicates the 24-hour average. |
|
■
|
Total: (Applicable only to Counters) Indicates the summation of all counter values. In other words, it does not reset to zero for each new interval. However, the total does reset after a device reset. In addition, you can reset this property per MIB module, by setting the ResetTotal object to the value 2: |
|
●
|
PM-Analog: acPMAnalogConfigurationResetTotalCounters |
|
●
|
PM-Control: acPMControlConfigurationResetTotalCounters |
|
●
|
PM-Media: acPMMediaConfigurationResetTotalCounters |
|
●
|
PM-PSTN: acPMPSTNConfigurationResetTotalCounters |
|
●
|
PM-System: acPMSystemConfigurationResetTotalCounters |
For example:
acPMMediaConfigurationResetTotalCounters.0 (integer) resetTotalCounters(2)
|
■
|
StateChanges: Indicates the number of times a state (mostly active/non-active) was toggled. |
Not all the properties listed above are applicable to every Performance Monitoring MIB. Properties that are not applicable are displayed as "-1" or as an empty cell.