
Dashboard
The Dashboard is the first screen you see when you sign in to Live Hub. It summarizes what the account has configured, which alarms are open, and how calls are performing. Each panel also serves as a shortcut: click a figure to open the screen behind it.
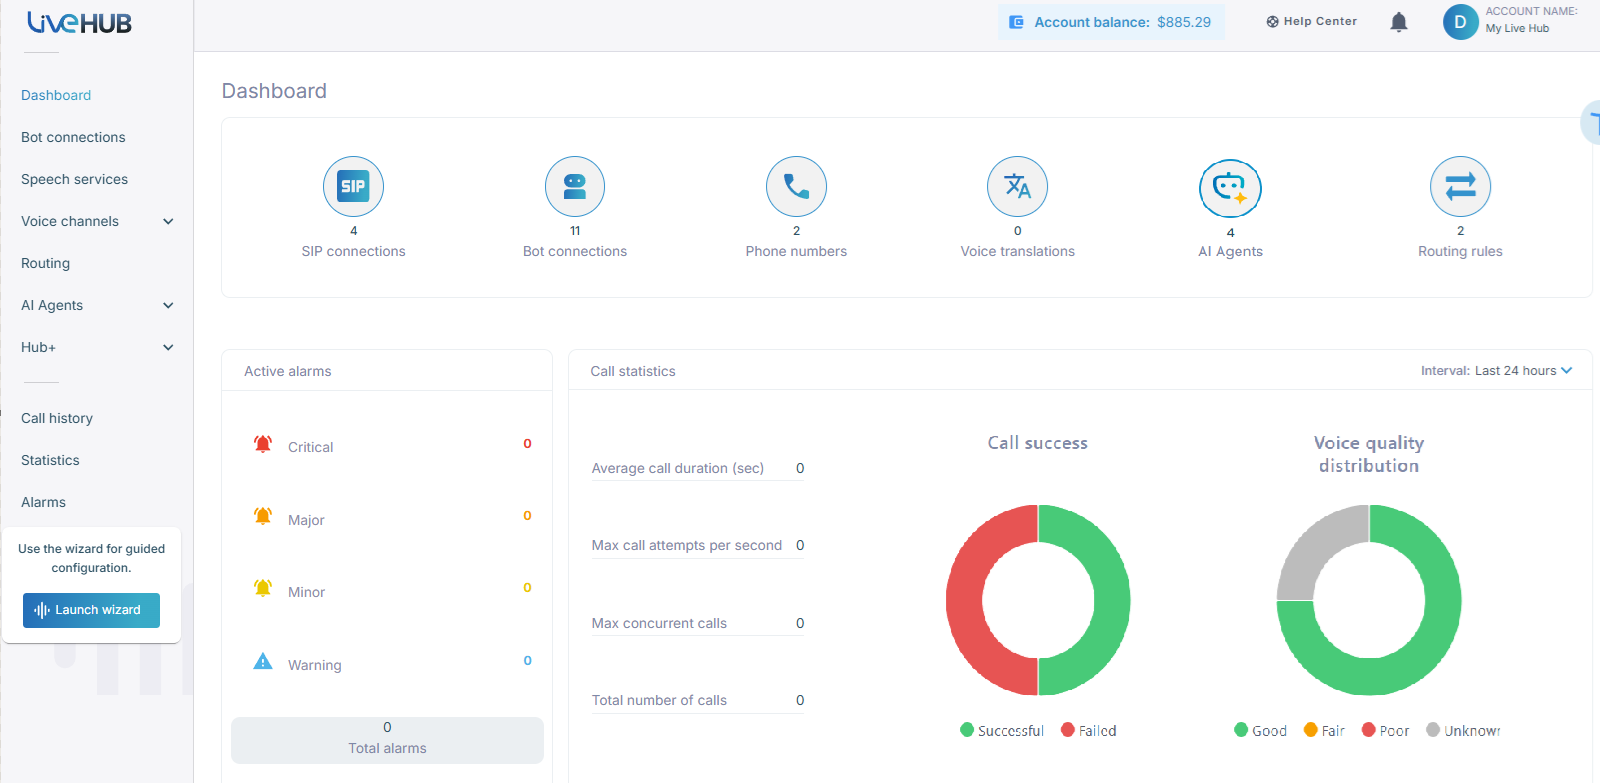
Configuration summary
The row of tiles across the top of the Dashboard counts what the account has configured. Click a tile to open the corresponding screen.
| Tile | Counts |
|---|---|
| SIP connections | SIP connections |
| Bot connections | Bot connections |
| Phone numbers | Phone numbers |
| Voice translations | Voice translation services |
| AI Agents | AI agents |
| Routing rules | Routing rules |
Active alarms
This panel reports how many alarms are currently open, broken down by severity into Critical, Major, Minor, and Warning, with the Total alarms count beside them. Click a severity to open Alarms filtered to that severity.
Call statistics
This panel presents four figures for the period selected in the 'Interval' drop-down list, which offers Last 5 minutes, Last hour, and Last 24 hours:
- Average call duration (sec)
- Max call attempts per second
- Max concurrent calls
- Total number of calls
A short interval shows what is happening now, while a longer one reveals a trend.
Live Hub aggregates call data in 5-minute windows, and each window becomes available approximately 5 minutes after the event. A call placed at 15:39 falls into the 15:35–15:40 window and is counted only once that window has closed.
Two charts accompany the figures. Click a segment of either chart to open call history:
- Call success compares successful calls against failed ones.
- Voice quality distribution groups calls by quality, as Good, Fair, Poor, or Unknown.
When the selected period contains no calls, the panel displays "There are no statistics to show".
Required permissions
Each panel is governed by its own permission. A Dashboard with panels missing therefore usually indicates a missing role rather than a missing configuration.
| Panel | Requires |
|---|---|
| Each configuration tile | read permission for that screen |
| Active alarms | livehub/alarms/read
|
| Call statistics | livehub/statistics/read
|
| Call success, Voice quality distribution | read permission for call history |
For the roles each policy grants, see Policies and roles.