
Statistics
The Statistics screen presents five charts of call activity over a period you select: how many calls succeeded, how heavily the system was loaded, and how the audio sounded. Where the Dashboard gives a single figure for the present moment, Statistics plots the same data over time.
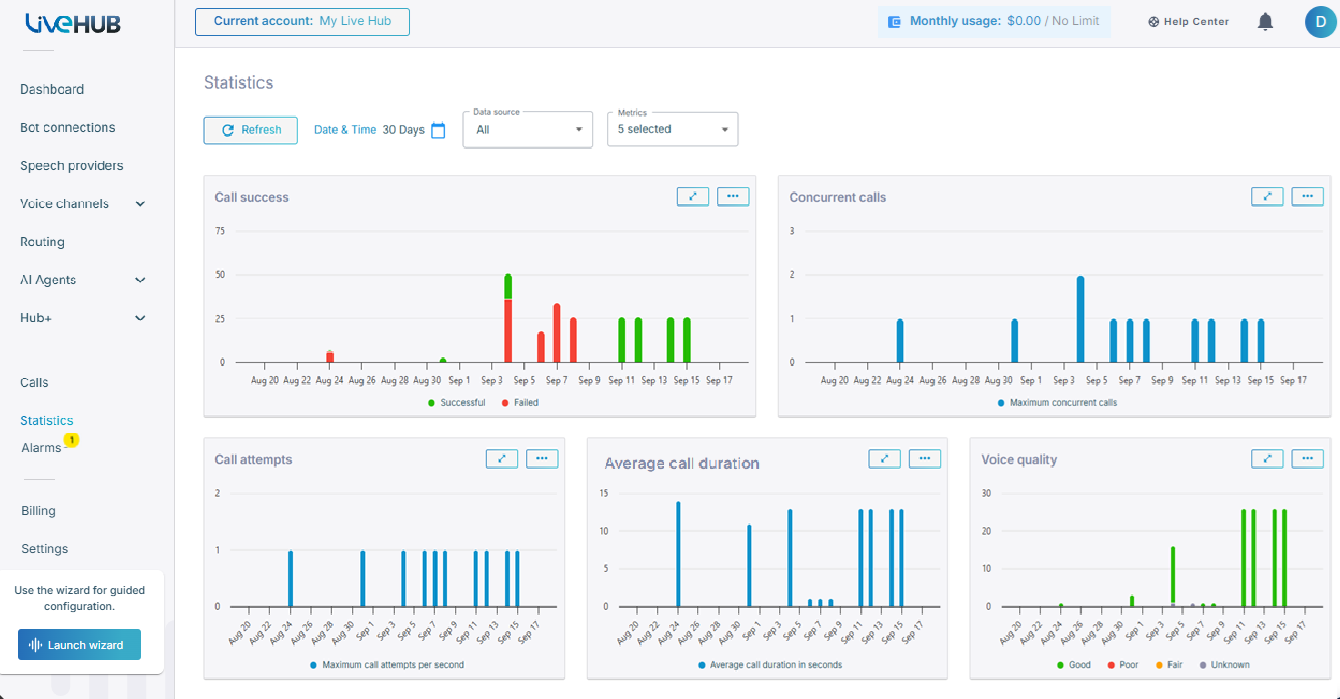
Every chart is also a way into call history: click a bar or a data point, and call history opens with the matching filters already applied. Hover over a bar for the figures behind it.
Statistics requires the livehub/statistics/read role.
Select what is charted
The filters sit above the charts, and the charts redraw as soon as you change one. Your choices are remembered for the session.
Date & time sets the period: 24 Hours, 7 Days, 30 Days, or a custom range. The period decides the granularity of the bars:
| Period | Interval per bar |
|---|---|
| 24 hours | hourly |
| 7 days, 30 days, or longer | daily |
| Custom range under 6 hours | 5 minutes |
From the 'Data source' drop-down list, select what to count. The default, All, covers the whole account; select a single bot connection, SIP connection, phone number, or Teams connection to see only that one.
From the 'Metrics' drop-down list, select which charts appear. All five are shown until you change it, after which your selection is remembered.
| Chart | Shows |
|---|---|
| Call success | Compares successful calls against failed ones: those that never connected or dropped abnormally. |
| Concurrent calls | Reports the highest number of calls running at once, counting the calling entity only. |
| Call attempts | Reports the highest number of attempts per second. Transferred calls are not counted. |
| Average call duration | Reports the mean length of completed calls, in seconds. |
| Voice quality | Groups calls by quality, as Good, Fair, Poor, and Unknown. |
Click Refresh to reload the data.
View, print, or download a chart
Each chart carries its own menu of viewing, printing, and download options.
To view, print, or download a chart:
-
Click the chart menu
 icon on the
chart's right side.
icon on the
chart's right side.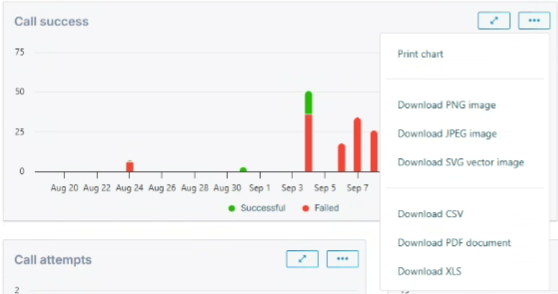
-
Select one of the following:
- View in full screen
- Print chart
- Download PNG image
- Download SVG vector image
- Download CSV
- Download PDF document
- Download XLS
Build custom charts
Statistics has a fixed set of charts. To build your own, with post-call-analysis insights, bot latency, and LLM activity alongside these, use Metrics (Preview).