Configuring Performance Profiles
The Performance Profile table lets you configure up to
You can configure the alarm thresholds for the following call metrics:
| ■ | Answer Success Ratio or ASR (also known as Answer Seizure Ratio): The number (in percentage) of answered calls (i.e. number of seizures resulting in an answer signal) out of the total number of attempted calls (seizures). The metric is calculated for the outgoing call leg. The metric includes the following SNMP performance monitoring MIBs: |
| ● | PM_gwSBCASR: ASR for all (global) entities (i.e., all IP Groups and SRDs) |
| ● | PM_gwSBCIPGroupASR: ASR per IP Group |
| ● | PM_gwSBCSRDASR: ASR per SRD |
If the configured ASR minor or major thresholds are crossed, the device raises the SNMP alarm, acASRThresholdAlarm (OID 1.3.6.1.4.1.5003.9.10.1.21.2.0.111).
To view ASR in the Web interface, see Viewing Call Success and Failure Ratio.
| ■ | Network Effectiveness Ratio (NER): The number (in percentage) of successfully connected calls out of the total number of attempted calls (seizures). The metric measures the ability of the network to deliver a call to the called terminal. In addition to answered calls, the following SIP response codes are regarded as successfully connected calls: 408 (Request Timeout), 480 (Temporarily Unavailable), and 486 (Busy Here). The metric is calculated for the outgoing call leg. The metric includes the following SNMP performance monitoring MIBs: |
| ● | PM_gwSBCNER: NER for all (global) entities (i.e., all IP Groups and SRDs) |
| ● | PM_gwSBCIPGroupNER: NER per IP Group |
| ● | PM_gwSBCSRDNER: NER per SRD |
If the configured NER minor or major thresholds are crossed, the device raises the SNMP alarm, AcNERThresholdAlarm (OID 1.3.6.1.4.1.5003.9.10.1.21.2.0.113).
| ■ | Average Call Duration (ACD): The ACD plus the session disconnect time (SDD) is the duration from when the SIP 200 OK is received to when the SIP Bye message is sent. The metric is calculated for both incoming and outgoing call legs. The metric includes the following SNMP performance monitoring MIBs: |
| ● | PM_gwSBCACD: ACD for all (global) entities (i.e., all IP Groups and SRDs) |
| ● | PM_gwSBCIPGroupACD: ACD per IP Group |
| ● | PM_gwSBCSRDACD: ACD per SRD |
If the configured ACD minor or major thresholds are crossed, the device raises the SNMP alarm, acACDThresholdAlarm (OID 1.3.6.1.4.1.5003.9.10.1.21.2.0.112).
To view ACD in the Web interface, see Viewing Average Call Duration.
At any given time during a call, a voice metric can be in one of the following color-coded quality states (as displayed in OVOC):
| ■ | Green: Indicates good call quality |
| ■ | Yellow: Indicates fair call quality |
| ■ | Red: Indicates poor call quality |
When the threshold of a voice metric is crossed, the device changes the alarm severity and corresponding color-coded quality state of the call:
| ■ | Minor Threshold (Yellow): Lower threshold that indicates changes from Green or Red to Yellow. |
| ■ | Major Threshold (Red): Higher threshold that indicates changes from Green or Yellow to Red. |
The device also uses hysteresis to determine whether the threshold has indeed being crossed. Hysteresis defines the amount of fluctuation from the threshold in order for the threshold to be considered as crossed (i.e., change in color state). Hysteresis is used to avoid false reports being sent by the device. Hysteresis is used only for threshold crossings toward a lesser severity (i.e., from Red to Yellow, Red to Green, or Yellow to Green).
The following example is used to explain how the device considers threshold crossings. The example is based on the ASR of a call, where the Major threshold is configured to 70%, the Minor threshold to 90% and the hysteresis for both thresholds to 2%:
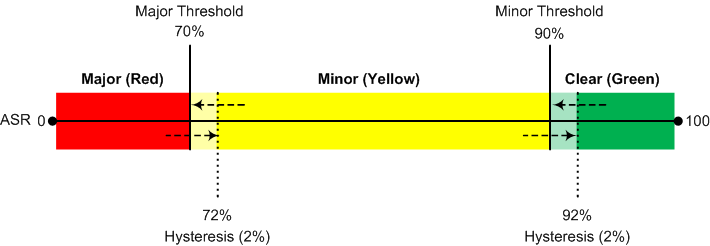
Threshold Crossings based on Threshold and Hysteresis
|
Threshold Crossing |
Calculation |
Threshold based on Example |
|---|---|---|
|
Green to Yellow (Minor alarm) |
The change occurs if the measured metric crosses the configured Minor threshold only (i.e., hysteresis is not used). |
90% |
|
Green to Red (Major alarm) |
The change occurs if the measured metric crosses the configured Major threshold only (i.e., hysteresis is not used). |
70% |
|
Yellow to Red (Major alarm) |
The change occurs if the measured metric crosses the configured Major threshold only (i.e., hysteresis is not used). |
70% |
|
Red to Yellow (Minor alarm) |
The change occurs if the measured metric crosses the configured Major threshold with hysteresis. |
72% (i.e., 70 + 2) |
|
Red to Green (alarm cleared) |
The change occurs if the measured metric crosses the configured Minor threshold with hysteresis. |
92 (i.e., 90 + 2) |
|
Yellow to Green (alarm cleared) |
The change occurs if the measured metric crosses the configured Minor threshold with hysteresis. |
92 (i.e., 90 + 2) |
| ● | Forwarded calls are not considered in the calculation for ASR and NER. |
| ● | If you don't configure thresholds for a specific metric, the device still provides current performance monitoring values of the metric, but does not raise any threshold alarms for it. |
| ● | You can configure the device to perform certain actions, for example, reject calls to the IP Group for a user-defined duration, if a threshold is crossed. For more information, see Configuring Quality of Service Rules. |
| ● | The section is applicable only to the SBC application. |
The following procedure describes how to configure Performance Profile rules through the Web interface. You can also configure it through ini file [PerformanceProfile] or CLI (configure system > performance-profile).
| ➢ | To configure a Performance Profile rule: |
| 1. | Open the Performance Profile table (Monitor menu > Monitor tab > Performance Monitoring folder > Performance Profile). |
| 2. | Click New; the following dialog box appears: |
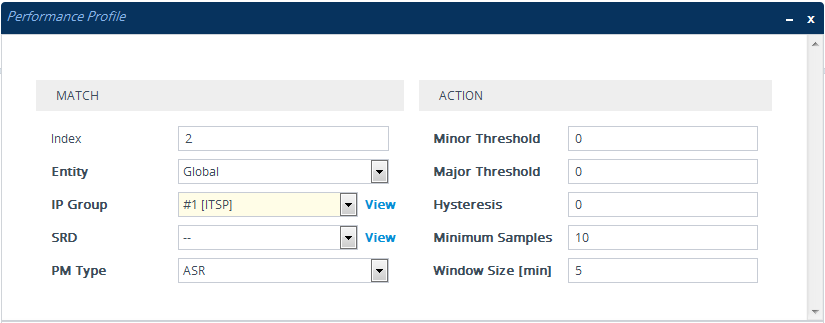
| 3. | Configure the rule according to the parameters described in the table below. |
| 4. | Click Apply. |
Performance Profile Table Parameter Descriptions
|
Parameter |
Description |
|||||||||
|---|---|---|---|---|---|---|---|---|---|---|
|
'Index' [PerformanceProfile_Index] |
Defines an index number for the new table row. Note: Each row must be configured with a unique index. |
|||||||||
|
Match |
||||||||||
|
'Entity' entity [PerformanceProfile_Entity] |
Defines a configuration entity type to which you want to apply the rule.
|
|||||||||
|
'IP Group' ip-group-name [PerformanceProfile_IPGroupName] |
Assigns an IP Group to the rule. Note: The parameter is applicable only if you configure the 'Entity' parameter to IP Group. |
|||||||||
|
'SRD' srd-name [PerformanceProfile_SRDName] |
Assigns an SRD to the rule. Note: The parameter is applicable only if you configure the 'Entity' parameter to SRD. |
|||||||||
|
'PM Type' pmtype [PerformanceProfile_PMType] |
Defines the type of performance monitoring metric for which you want to configure thresholds.
|
|||||||||
|
Action |
||||||||||
|
'Minor Threshold' minor-threshold [PerformanceProfile_MinorThreshold] |
Defines the Minor threshold (in percentage) of the selected performance monitoring metric, which is the lower threshold located between the Yellow and Green states. To consider a threshold crossing:
The valid range is 0 to 100. The default is 0. |
|||||||||
|
'Major Threshold' major-threshold [PerformanceProfile_MajorThreshold] |
Defines the Major threshold (in percentage) of the selected performance monitoring metric, which is the upper threshold located between the Yellow and Red states. To consider a threshold crossing:
The valid range is 0 to 100. The default is 0. |
|||||||||
|
'Hysteresis' hysteresis [PerformanceProfile_Hysteresis] |
Defines the amount of fluctuation (hysteresis) from the configured threshold in order for the threshold to be considered as crossed. Hysteresis is used to avoid false reports being sent by the device. Hysteresis is used only when the severity level decreases (i.e., from Red to Yellow, Yellow to Green, or Red to Green). The valid value is 0 to 15 (in percentage). The default is 5. For example, if you configure the 'Major Threshold' parameter to 70% and the 'Hysteresis' parameter to 2%, the device considers a threshold crossing from Red to Yellow only if the ASR crosses 72% (i.e., 70% + 2%). |
|||||||||
|
'Minimum Samples' minimum-samples [PerformanceProfile_MinimumSample] |
Defines the minimum number of call sessions (sample) that is required for the device to calculate the performance monitoring metrics (per window size). If the number of call sessions is less than the configured value, no calculation is done. The default is 10 calls. Note: The calculation also depends on the configured sampling window size (see 'Window Size' parameter). For example, if the parameter is configured to 10 calls, but only 5 calls were processed during the configured sampling window, no calculation is done. |
|||||||||
|
'Window Size' window-size [PerformanceProfile_WindowSize] |
Defines the time interval (in minutes) during which the device calculates the performance monitoring metrics. For example, if the parameter is configured to five minutes, the calculation is done for the last five minutes. The default is 5 minutes. Note: The calculation depends on the configured minimum samples (see 'Minimum Samples' parameter). For example, if the parameter is configured to five minutes, but the number of calls during the interval is less than the configured minimum samples, no calculation is done. |
|||||||||