Viewing Alarms History
You can view all SNMP alarms that have been raised (i.e., active alarms) and cleared (i.e., resolved alarms) in the Web interface's Alarms History table. One of the benefits of this is that you can view alarms that may have been raised and then cleared on a continuous basis. For example, such an alarm may be raised due to an Ethernet cable that is not securely attached to the device's Ethernet port, causing the Ethernet link to be sometimes up and sometimes down. This alarm would not be listed in the Active Alarms table due to it being cleared.
By default, the Alarms History table displays only SNMP trap alarms. You can also display SNMP trap events (explained later in this section). Hide trap events to reduce clutter and focus on alarms, which are typically more important than events.
The alarms in the table are displayed from latest to oldest, where the most recently raised alarm is listed first in the table. The table displays both the cleared alarm and the alarm for which it was cleared next to one another.
To configure the maximum number of alarms that can be displayed in the table, use the [AlarmHistoryTableMaxSize] parameter. If the maximum is reached and a new alarm is added to the table, the oldest alarm is removed from the table to accommodate the new alarm.
| ● | The device deletes all the alarms in the table upon a device restart (or power off). In other words, all the alarms listed in the Alarms History table occurred from after the last device restart. If you want to store the alarms on the device's flash memory so that they also remain listed after a restart, see Storing (Persistent) Alarms History on Flash. |
| ● | For a description of the SNMP alarms, refer to the device's SNMP Alarm Reference Guide. |
The following procedure describes how to view the Alarms History table through the Web interface. You can also view it through or CLI (show system alarms-history).
| ➢ | To view history alarms: |
| 1. | Open the Alarms History table (Monitor menu > Monitor tab > Summary folder > Alarms History). The following figure shows an example of the Alarms History table: |
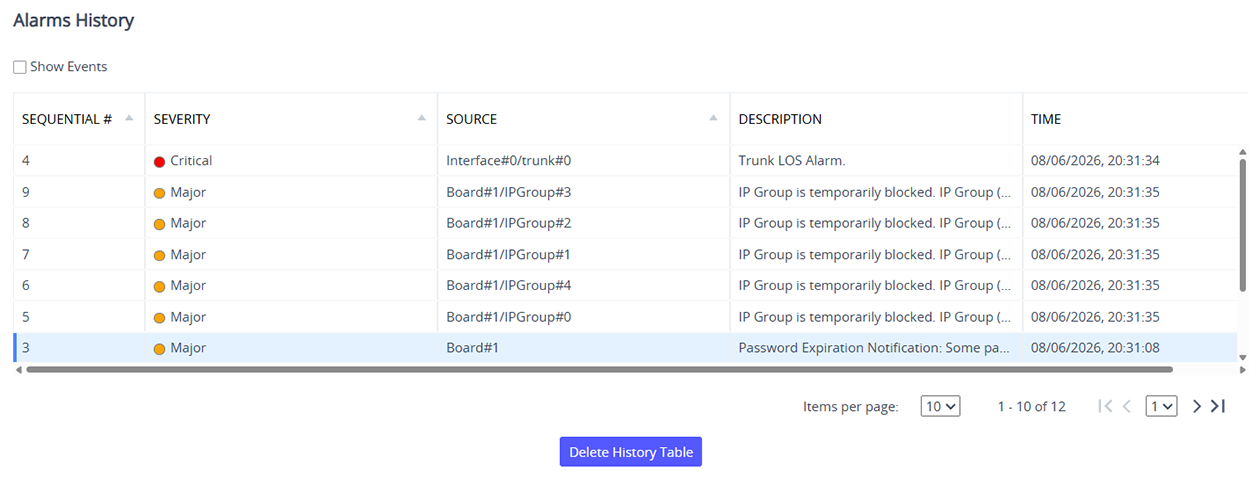
| 2. | To show or hide SNMP trap events in the table, select or clear the Show Events check box. |
| 3. | Use the pagination controls located below the table to do the following: |
| ● | Configure the maximum number of alarms (rows) displayed per page (10, 20, or 50). |
| ● | Jump to the next or previous page. |
| ● | Jump to the first or last page. |
The following table describes the columns of the Alarms History table:
Alarms History Table Description
|
Field |
Description |
|||||||||||||||
|---|---|---|---|---|---|---|---|---|---|---|---|---|---|---|---|---|
|
Sequential # |
Displays the number of the alarm. The alarms are numbered sequentially as they are raised by the device. The numbering resets to 1 immediately after a device restart (i.e., first alarm raised after a restart is assigned the number #1). |
|||||||||||||||
|
Severity |
Displays the severity level of the alarm:
Note: Indeterminate indicates a trap event, which typically don't have severity levels. |
|||||||||||||||
|
Source |
Displays the component of the device for which the alarm was raised. |
|||||||||||||||
|
Description |
Displays the description of the alarm. |
|||||||||||||||
|
Time |
Displays the date (DD/MM/YYYY) and time (HH:MM:SS) the alarm was raised. Note: The date and time of the alarm is based on the device's local date and time. |
|||||||||||||||
|
Type |
Indicates if the alarm is an SNMP trap alarm ("Alarm") or event ("Event"). Note: This column only appears when you select the Show Events check box. |
|||||||||||||||
|
Note |
This column is displayed only if you have enabled the device to save alarms to flash memory. For more information, see Storing (Persistent) Alarms History on Flash |


