Performance monitoring
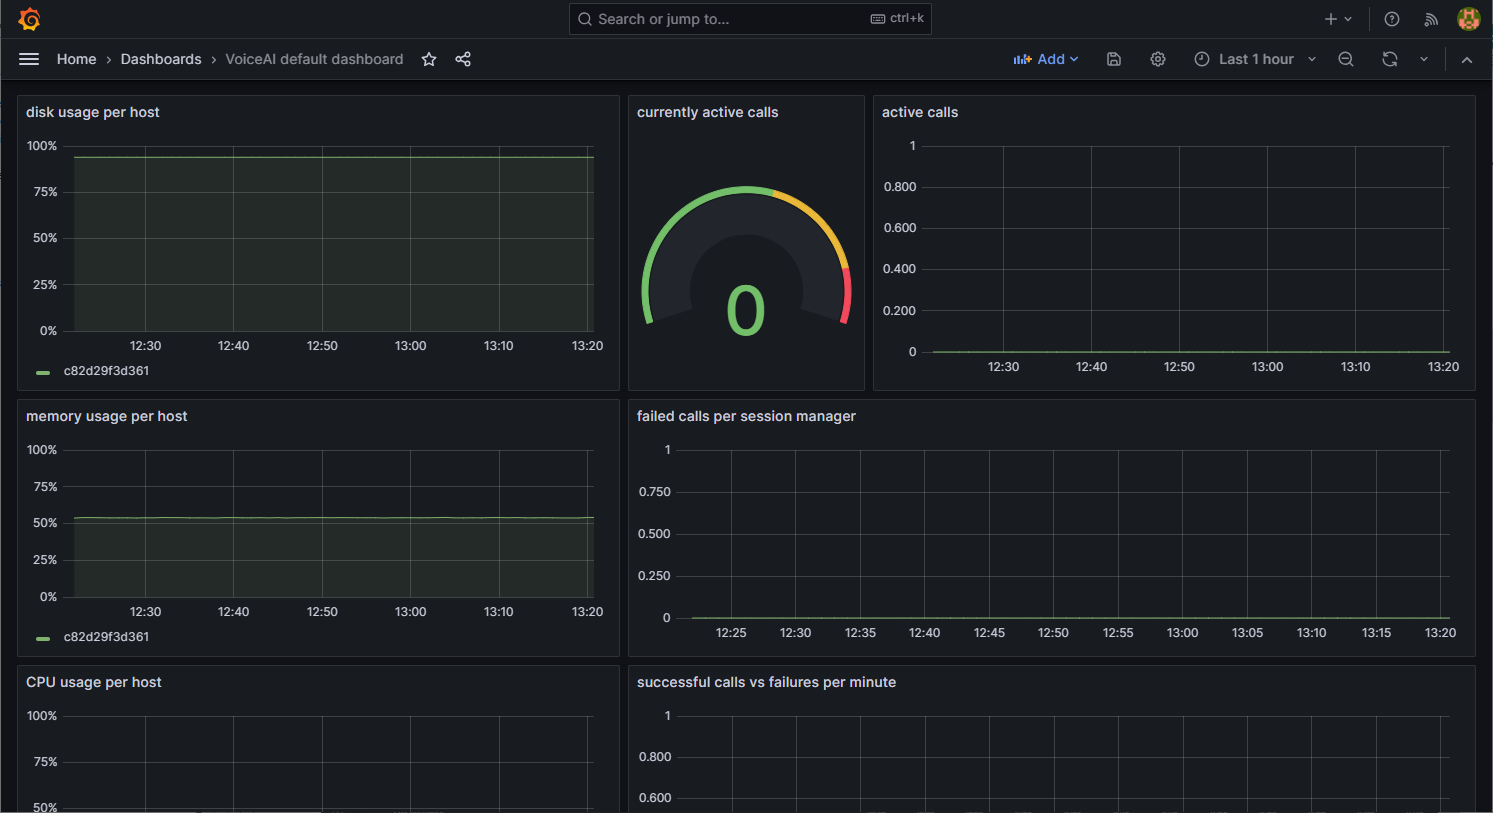
You can view a wide range of statistical information through the VoiceAI Connect Enterprise Web UI. VoiceAI Connect Enterprise uses the open-source Grafana monitoring tool, which provides a default dashboards with various graphs displaying statistical information.
For viewing or editing performance monitoring, your Administrator needs to provide you with the appropriate IAM policy (roles and scopes). For more information, see Managing users.
For a full description of using Grafana, see Grafana's documentation at https://grafana.com/docs/grafana/latest/.
The statistical data is retrieved from VoiceAI Connect Enterprise's InfluxDB database server and displayed on the following default dashboards:
-
VoiceAI default dashboard:
-
Disk usage per host
-
Memory usage per host
-
CPU usage per host
-
Currently active calls (gauge)
-
Active calls
-
Failed calls per Session Manager
-
Successful calls versus failed calls
-
-
VoiceAI bots dashboard:
-
Total number of failed calls per bot (bar graph)
-
Total number of calls per bot (bar graph)
-
Active calls per bot
-
Bot messages and failures per bot
-
Text-to-speech characters per bot
-
Speech-to-text billing time per bot
-
-
VoiceAI providers dashboard:
-
Speech-to-text requests and failures per provider
-
Text-to-speech requests and failures per provider
-
Text-to-speech delay (max. and average) per provider
-
If you want, you can also create your own dashboard and choose the statistical graphs that you want on them.
To view performance monitoring:
-
From the Navigation menu, click Monitoring.

-
To view a default dashboard or create a new dashboard:
-
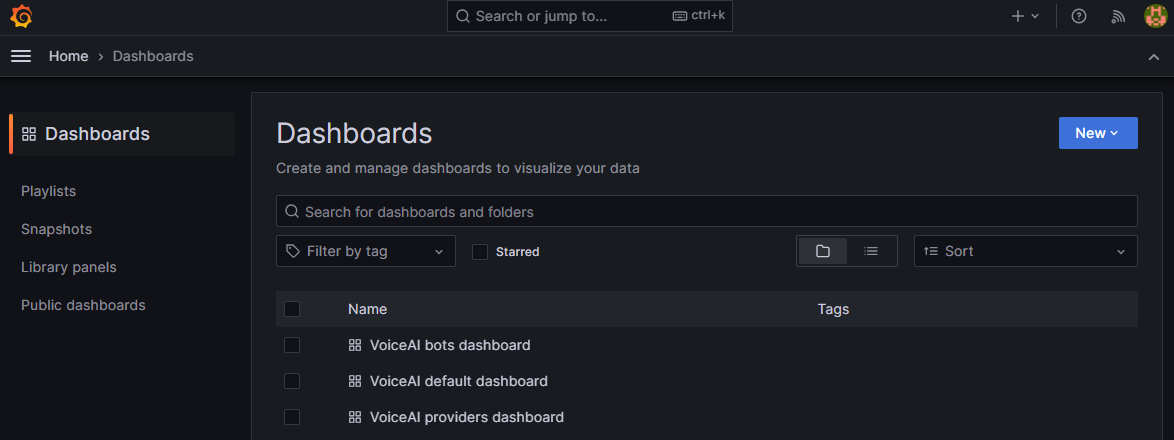
Click the hamburger icon in the top-left corner to open the navigation menu.
-
Select Dashboards, and then in the right pane, select the desired default dashboard or click New to create one:
-

-
Some of the actions that you can do in Grafana:
-
On the top-right corner, a bar with buttons allows you to perform various operations: you can click to refresh the data periodically. You can click to change the time range for the statistical data. You can also save a snapshot of the dashboard.
-
You can edit the dashboard, or copy it and then edit the copy.
-
Hovering over a graph shows the data in numbers.
-
Hovering over a graph and then pressing the "v" key shows the graph in full screen.
-
Dragging the mouse over a period in a single graph view, zooms the graph to that time range.
-
The KPIs available for use in Grafana queries are listed in the following table:
|
Measurement |
Field |
Tag indexes |
Description |
|---|---|---|---|
|
disk |
used_percent |
host |
Main partition usage in percentage |
|
mem |
available_percent |
host |
Total available RAM in percentage |
|
cpu |
usage_idle |
host |
Total CPU idle in percentage |
|
status |
CallAttemptsPerMinute |
botId, ttsProviderId, sttProviderId, sessionManagerId |
Call attempts per minute |
|
status |
SuccessfulCallsPerMinute |
botId, ttsProviderId, sttProviderId, sessionManagerId |
Successful calls per minute |
|
status |
CallEndingsPerMinute |
botId, ttsProviderId, sttProviderId, sessionManagerId |
Call endings per minute (success and failures) |
|
status |
STTFailuresPerMinute |
botId, ttsProviderId, sttProviderId, sessionManagerId |
STT failures per minute |
|
status |
TTSFailuresPerMinute |
botId, ttsProviderId, sttProviderId, sessionManagerId |
TTS failures per minute |
|
status |
BotFailuresPerMinute |
botId, ttsProviderId, sttProviderId, sessionManagerId |
Bot failures per minute |
|
status |
SBCFailuresPerMinute |
botId, ttsProviderId, sttProviderId, sessionManagerId |
SBC failures per minute |
|
status |
PlayUrlFailuresPerMinute |
botId, ttsProviderId, sttProviderId, sessionManagerId |
PlayUrl failures per minute |
|
status |
AverageCallDurationSeconds |
botId, ttsProviderId, sttProviderId, sessionManagerId |
Average call duration in seconds |
|
status |
IncomingMessagesPerMinute |
botId, ttsProviderId, sttProviderId, sessionManagerId |
Bot incoming messages per minute |
|
status |
OutgoingMessagesPerMinute |
botId, ttsProviderId, sttProviderId, sessionManagerId |
Bot outgoing messages per minute |
|
status |
AverageTTSDelayMilliseconds |
botId, ttsProviderId, sttProviderId, sessionManagerId |
Average TTS delay in milliseconds |
|
status |
MaxTTSDelayMilliseconds |
botId, ttsProviderId, sttProviderId, sessionManagerId |
Max TTS delay in milliseconds |
|
status |
TTSRequestsPerMinute |
botId, ttsProviderId, sttProviderId, sessionManagerId |
TTS requests per minute (not cached) |
|
status |
TTSCharactersPerMinute |
botId, ttsProviderId, sttProviderId, sessionManagerId |
TTS characters per minute (not cached) |
|
status |
CachedTTSRequestsPerMinute |
botId, ttsProviderId, sttProviderId, sessionManagerId |
Cached TTS requests per minute |
|
status |
CachedTTSCharactersPerMinute |
botId, ttsProviderId, sttProviderId, sessionManagerId |
Cached TTS characters per minute |
|
status |
STTRawTimeInSecondsPerMinute |
botId, ttsProviderId, sttProviderId, sessionManagerId |
STT raw time (in seconds) per minute |
|
status |
STTBillingTimeInSecondsPerMinute |
botId, ttsProviderId, sttProviderId, sessionManagerId |
STT billing time (in seconds) per minute |
|
status |
STTRequestsPerMinute |
botId, ttsProviderId, sttProviderId, sessionManagerId |
STT requests per minute |
|
status |
PlayUrlRequestsPerMinute |
botId, ttsProviderId, sttProviderId, sessionManagerId |
PlayUrl requests per minute (not cached) |
|
status |
CachedPlayUrlRequestsPerMinute |
botId, ttsProviderId, sttProviderId, sessionManagerId |
Cached PlayUrl requests per minute |
|
status |
AveragePlayUrlDelayMilliseconds |
botId, ttsProviderId, sttProviderId, sessionManagerId |
Average PlayUrl delay in milliseconds |
|
status |
MaxPlayUrlDelayMilliseconds |
botId, ttsProviderId, sttProviderId, sessionManagerId |
Max PlayUrl delay in milliseconds |
|
status |
ActiveCalls |
botId, ttsProviderId, sttProviderId, sessionManagerId |
Currently active calls |
|
status |
SuccessfulOutboundCallsPerMinute |
botId, ttsProviderId, sttProviderId, sessionManagerId |
Successful outbound calls per minute |
|
status |
OutboundCallEndingsPerMinute |
botId, ttsProviderId, sttProviderId, sessionManagerId |
Outbound call endings per minute (success and failures) |
|
status |
CompletedOutboundCallsPerMinute |
botId, ttsProviderId, sttProviderId, sessionManagerId |
Completed (answered and ended successfully) outbound calls per minute |
|
status |
ThrottledCallsPerMinute |
botId, ttsProviderId, sttProviderId, sessionManagerId |
Throttled calls per minute (by call throttling feature) |
