SIP Connections Management
SIP Connections are entities created by Live Platform that represent logical SIP communication paths between a SIP entity representing the managed service and the SBC device that is configured to route the calls for this managed service. The links are used for the purpose of measuring Voice Quality metrics on the calls traversing the connection where Call Data Records are retrieved from the SBC device and then Voice Quality reports are generated based on these CDRs for the managed service entities. A link is created for each service. The following describes the logical entities that are used to represent the SIP connection for the different service types:
| ■ | Direct Routing: An IP Group is created for each service on the managed SBC device. When a Microsoft Teams device is configured, the Microsoft Teams Subscriber Notifications Services (see Managing Teams Devices) retrieves the Call Data Records for the Microsoft Teams to SBC and for calls between Teams clients. |
| ■ | Operator Connect: When a new customer service is created from a lead ,either the customer's Microsoft Azure Tenant Id is used. For this scenario, the SIP communication path is over a shared IP group representing a Peering trunk connection. Alternatively, the communication path may be over a unique IP Group (Private Trunk) that is created when the Advanced Settings are configured (see Creating OC Essential Customer). |
| ■ | For Zoom, Live CX, WebEX and Live UC: An IP Group is created for each service on the SBC device. In addition, a unique Connection ID is created for each service. |
The alarms reported for SIP Connections include the following SBC IP Group alarms:
| ■ | acIpGroupKeepAliveAlarm (OID 1.3.6.1.4.1.5003.9.10.1.21.2.0.163) |
| ■ | acAccountRegistrationAlarm (1.3.6.1.4.1.5003.9.10.1.21.2.0.164) |
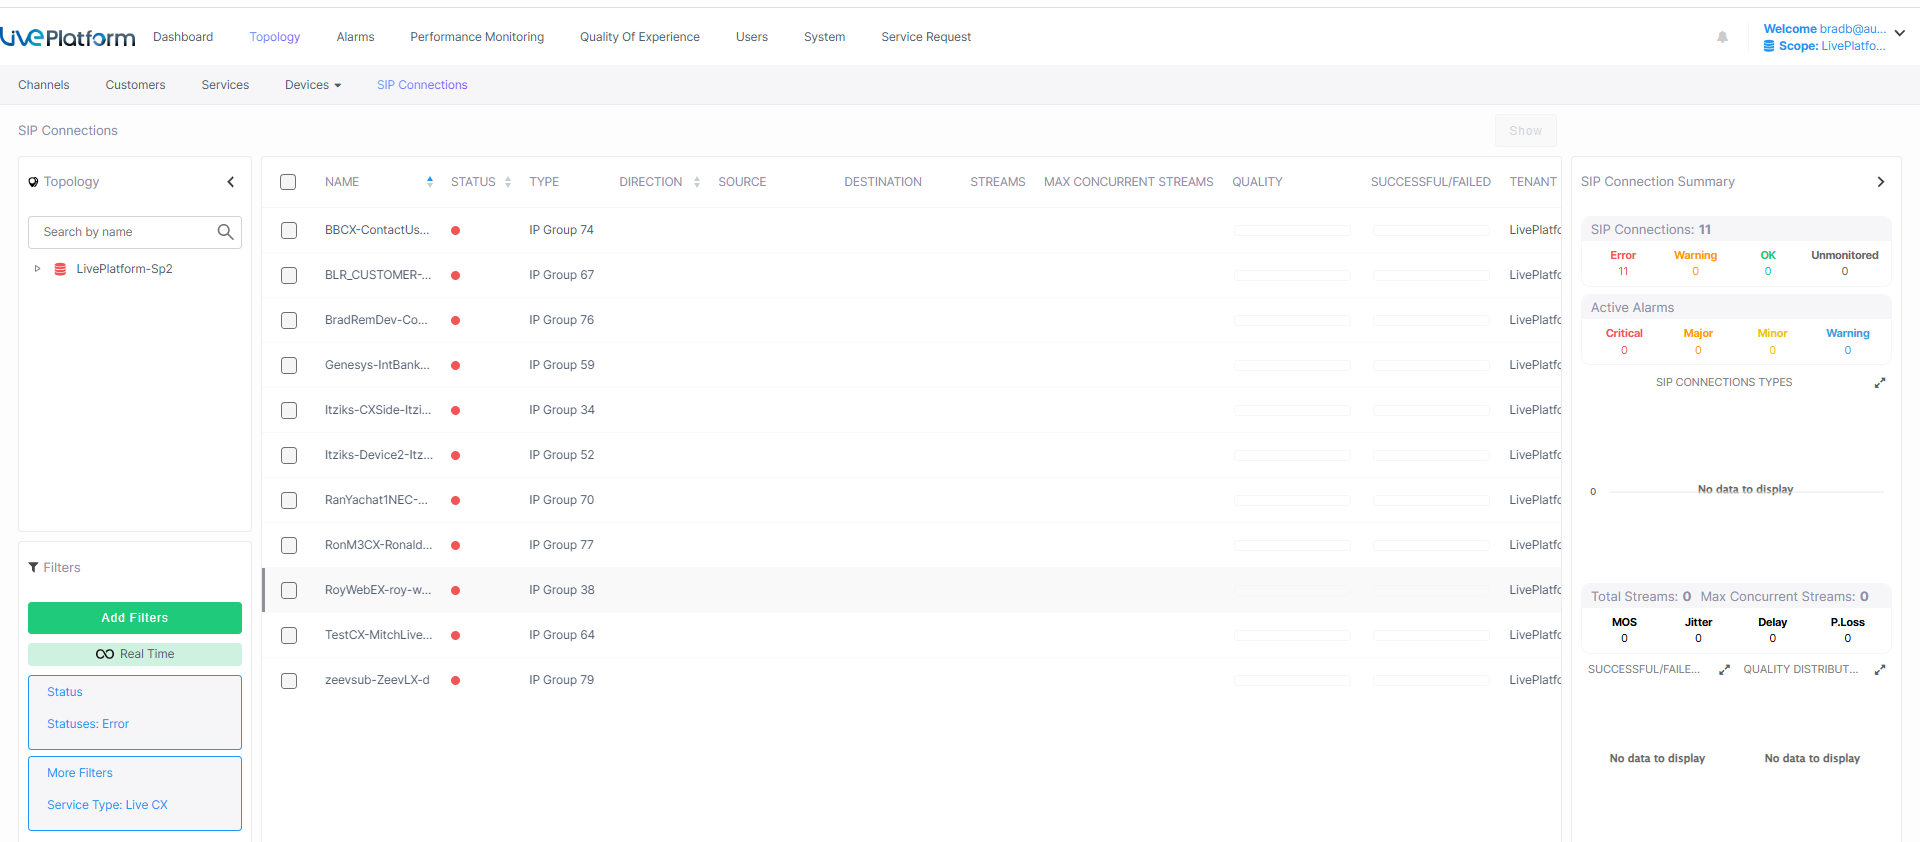
| ➢ | To view SIP connections: |
| 1. | In the menu, choose Topology > SIP Connections. |
The table below describes the parameters in this screen.
|
Parameter |
Description |
|---|---|
|
Name |
Name of the connection derived from the Service name. |
|
Status |
Management status of the connection (see Management Statuses). |
|
Type |
Type of link between SIP entity and Live Platform ; IP group or Tenant ID. |
|
Direction |
Call direction: Bi-Directional |
|
Source |
FQDN of the SBC device. |
|
Destination |
Name of the link based on the name of the service. For connections created based on Tenant ID, a random string is created. |
|
Streams |
Measures the Successful and Failed Streams for the customer service. |
|
Max Concurrent Streams |
Measures the Maximum Concurrent Streams for the customer service. |
|
Quality |
Measures the Streams Quality for the customer service. |
|
Successful / Failed |
Measures the Successful and Failed calls for the customer service. |
|
Tenant |
Name of the Service Provider tenant for the customer service. |
|
Region |
Name of the region attached to the tenant. |
|
Customer |
Name of the customer attached to the service. |
|
Service |
Name of the customer service. |
The SIP Connection Summary includes a summary of all SIP Connections for the Service Provider tenant.
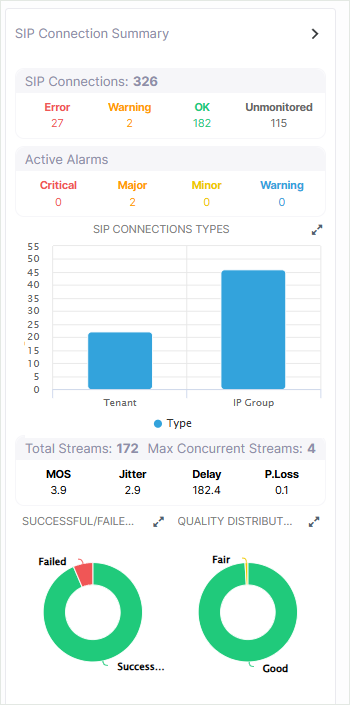
The SIP Connection Summary components are described in the table below.
|
Parameter |
Description |
||||||||||||
|---|---|---|---|---|---|---|---|---|---|---|---|---|---|
|
SIP Connection Management Statuses |
Drill-down to the Historical Alarms Summary for each category:
For example, the figure below shows a list of SIP connections with hHistorical error alarms.
|
||||||||||||
|
Active Alarms Summary |
Drill-down to the Active Alarms Summary for each category:
|
||||||||||||
| SIP Connection Types |
SIP Connection Type:
|
||||||||||||
|
Total Streams |
Shows the total number of call streams. |
||||||||||||
|
Maximum Concurrent Streams |
The maximum number of concurrent streams. |
||||||||||||
|
MOS |
Indicates the Voice Quality Score for the MOS metric: Mean Opinion Score (specified by ITU-T recommendation P.800) - the average grade on quality scales of Good to Failed, given to voice calls made over a VoIP network at the conclusion of the testing. |
||||||||||||
|
Jitter (msec) |
Indicates the Voice Quality Score for the Jitter metric: Jitter can result from uneven delays between received voice packets. To space packets evenly, the jitter buffer adds delay. The higher the measurement, the greater the impact of the jitter buffer’s delay on audio quality. Two Jitter values are shown, one value for the caller side and one value for the callee side. |
||||||||||||
|
Delay (msec) |
Indicates the Voice Quality Score for the Delay metric: Delay or latency - the time it takes for information to travel from source to destination (round-trip time). Sources of delay include voice encoding / decoding, link bandwidth and jitter buffer depth. Two Delay values are shown, one value for the caller side and one value for the callee side. |
||||||||||||
|
Packet Loss (%) |
Indicates the Voice Quality Score for the Lost packets: RTP packets that aren’t received by the voice endpoint for processing, resulting in distorted voice transmission. Two Packet Loss % values are shown, one value for the caller side and one value for the callee side. Packet Loss can be greater than 100%. |
||||||||||||
|
Successful/Failed Calls |
Displays the % and # of calls whose performance was evaluated as successful or failed, distributed over time The chart lets you assess calls performance at a glance. The chart shows when successful calls peaked compared to when failed calls peaked. You can compare this to other charts to identify correlations. Click to drill down to the details of the selected data segment. |
||||||||||||
|
Quality Distribution |
Displays the distribution of voice quality (% and # of calls whose voice quality scored Good Fair or Poor) over time. Gray indicates 'Unknown' voice quality. Point the cursor over a color-coded bar segment in any time period to view this pop-up. The date and time indicates when the period ended. Click to drill down to the details of the selected data segment. |