View the Dashboard
The Dashboard provides a quick glance summary for all managed entities including:
| ■ | Entity Statistics pie-charts with break down of customers, service providers, models (device types) and firmware. |
| ■ | Breakdown of phone status reporting including which phones in the network are registered, unregistered and disconnected |
| ■ | Firmware updates notifications |
| ■ | Alarm notifications |
| ■ | User login journal |
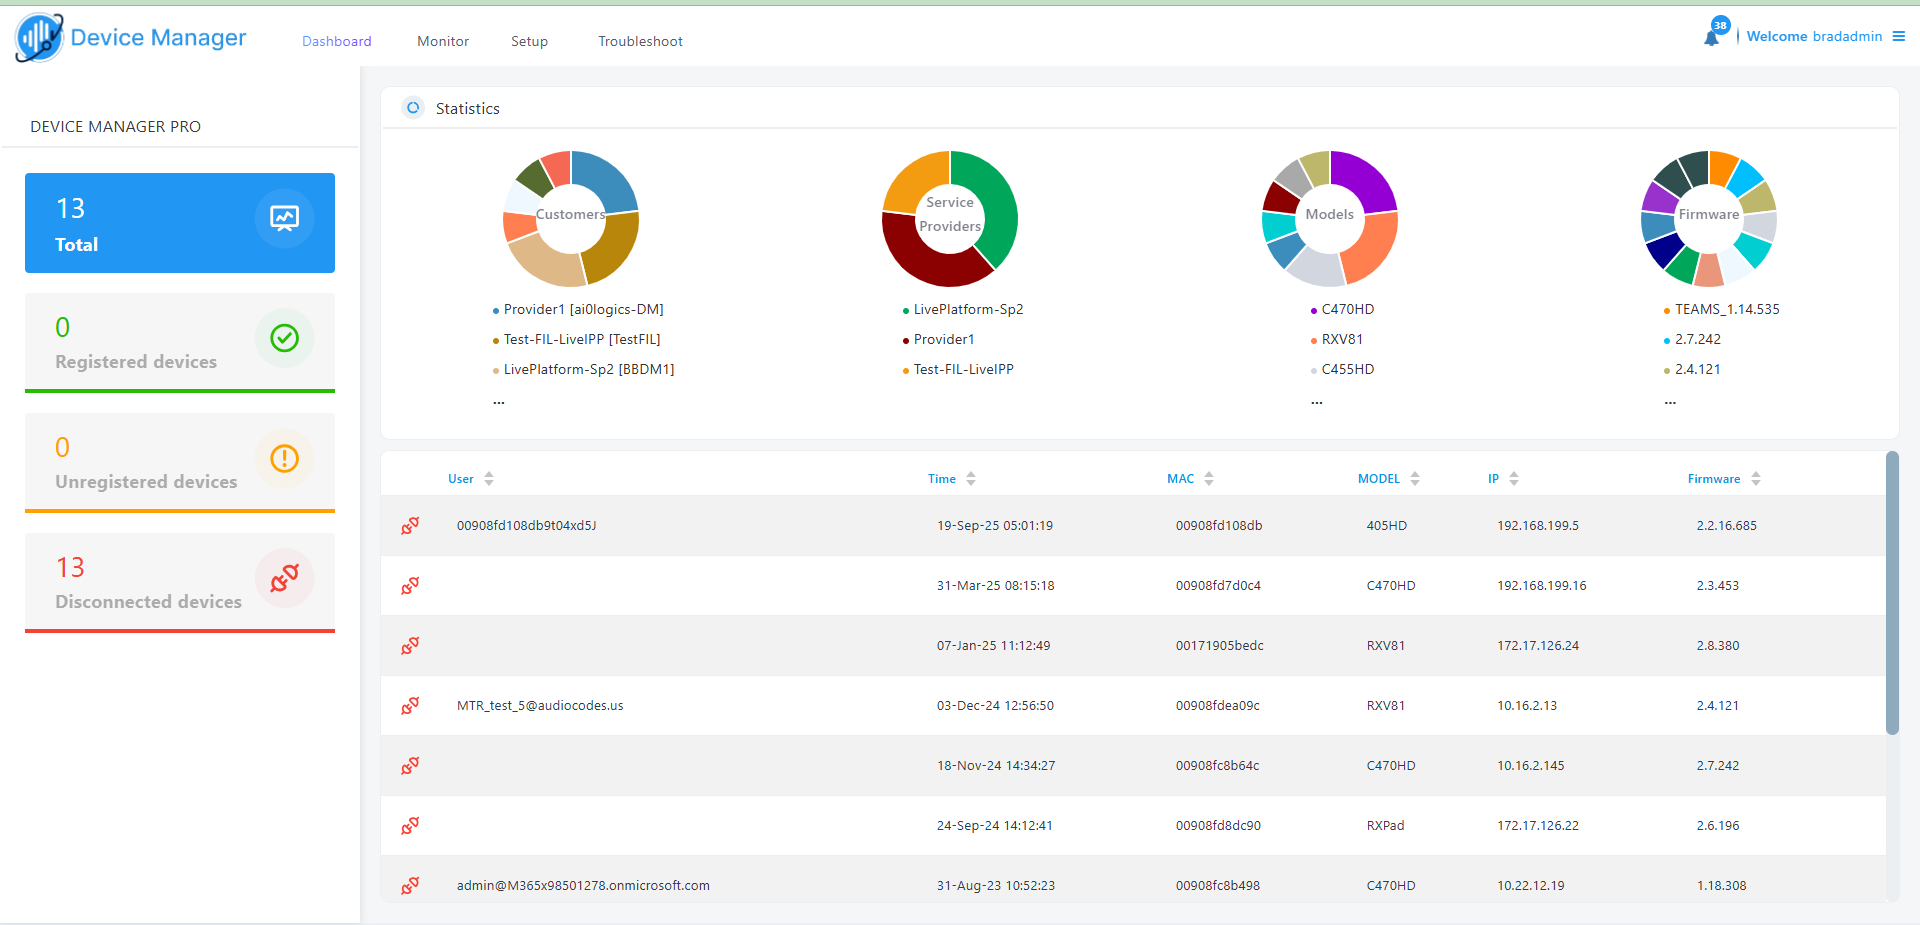
The table below describes the components in the Dashboard.
|
Component |
Description |
|---|---|
|
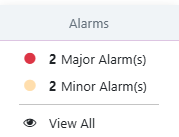
Alarm Notifications
|
Click the bell located in the upper right corner of the Dashboard to display a list of active alarm notifications for managed endpoints. Click View All to view entire list. Click each alarm segment to drill down to a list of alarms for the selected segment (see Monitor Alarms). |
|
'DEVICE MANAGER PRO' summary pane |
|
|
Displays the device count by registration status. |
|
|
|
Indicates the number of devices running the version stated above it. |
|
|
Indicates the number of registered devices. Click to quickly access the Devices Status page displaying registered devices. |
|
|
Indicates the number of unregistered devices. Click to quickly access the Devices Status page displaying unregistered devices. |
|
|
Indicates the number of disconnected devices. Click to quickly access the Devices Status page displaying disconnected devices. |
|
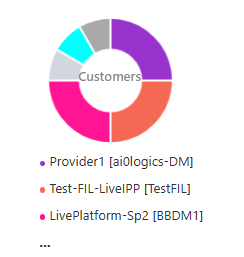
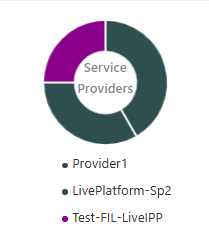
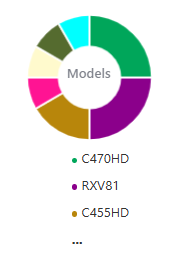
Statistics pane |
|
|
Displays breakdowns of the different management entities. Position your cursor over each segment to view details. Click a segment for context-sensitive drill-down to the Devices Status page for the selected entity. The following pie-charts are displayed: |
|
|
|
Pie chart showing the number of customers per service provider that are registered. Hover over a segment of the pie to view the service provider's name and the number of devices registered under it. Click a segment of the pie to open the Devices Status page displaying that customer and the devices registered under it. |
|
|
Pie chart showing the number of devices per service provider that are registered. Hover over a segment of the pie to view the service provider's name and the number of devices registered under it. Click a segment of the pie to open the Devices Status page displaying that service provider and the devices registered under it. |
|
|
Pie chart showing the number of devices per model type that are registered. Hover over a segment of the pie to view the device type name and the number of devices registered under it. Click a segment of the pie to open the Devices Status page displaying that device type and the devices registered under it. |
|
|
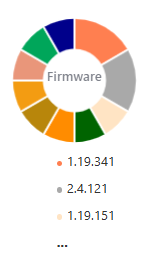
Pie chart showing the number of devices per firmware version that are registered. Hover over a segment of the pie to view the firmware version and the number of devices installed for this version. Click a segment of the pie to open the Devices Status page displaying the devices installed with this firmware. |
|
User Login Journal |
|
|
Displays details of when users login to managed endpoints. The following details are displayed: User; Time; MAC; Model; IP; Firmware. The status column indicates the following: |
|
|
|
The device is offline, or not registered , you'll see an icon of a gray tick inside a gray circle, and the 'User' column will be blank. Counted as a Non Registered Device. |
|
|
The device is disconnected. |
|
|
The device is registered. |
|
|
If the device is not registered, you'll view a red triangle enclosing an exclamation mark. |
|
|
Click this link to open the Device Status page (see here). |