Viewing Data Network Performance Monitoring
You can view network performance monitoring of the device's data-router functionality through the Web interface. This
| ➢ | To view data network performance monitoring: |
| ■ | Open the Network Performance Monitors page (Monitor menu > Monitor tab > Data Status folder > Network Performance Monitors). |
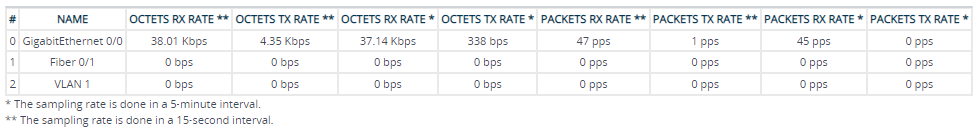
The figure below displays an example of the Network Performance Monitors page:
Network Performance Monitors Page Description
|
Field |
Description |
|---|---|
|
'Name' |
Network interface name. |
|
'Octets Rx Rate' |
Receive rate in bits per second (bps). Column labels with a single asterisk (*) show values that are calculated in a 5-minute sampling interval; column labels with two asterisks (**) show values that are calculated in a 15-second sampling interval. |
|
'Octets Tx Rate' |
Transmit rate in bits per second (bps). Column labels with a single asterisk (*) show values that are calculated in a 5-minute sampling interval; column labels with two asterisks (**) show values that are calculated in a 15-second sampling interval. |
|
'Packets Rx Rate' |
Receive rate in packets per second (pps). Column labels with a single asterisk (*) show values that are calculated in a 5-minute sampling interval; column labels with two asterisks (**) show values that are calculated in a 15-second sampling interval. |
|
'Packets Tx Rate' |
Transmit rate in packets per second (pps). Column labels with a single asterisk (*) show values that are calculated in a 5-minute sampling interval; column labels with two asterisks (**) show values that are calculated in a 15-second sampling interval. |