Viewing Data Network Statistics
You can view network statistics of the device's data-router functionality through the Web interface. You can also view this information through the CLI, using the command show data interfaces <interface>.
| ➢ | To view data network statistics: |
| ■ | Open the Network Statistics page (Monitor menu > Monitor tab > Data Status folder > Network Statistics). |
The figure below displays an example of the Network Statistics page:
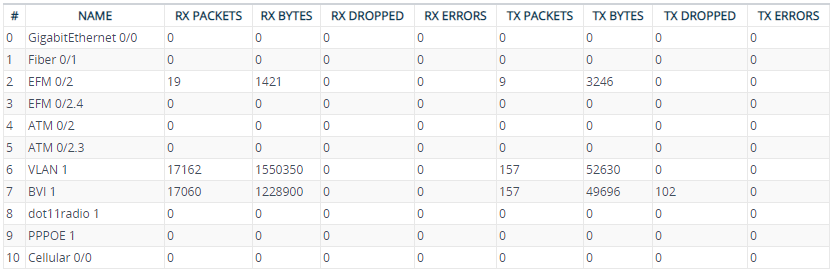
Network Statistics Page Description
|
Field |
Description |
|---|---|
|
Name |
Network interface name. |
|
Rx Packets |
Number of received packets. |
|
Rx Bytes |
Number of received bytes. |
|
Rx Dropped |
Number of received packets that were dropped. |
|
Rx Errors |
Number of packets received incorrectly that has a CRC error and a non-integer number of octets (alignment error). |
|
Tx Packets |
Number of transmitted packets. |
|
Tx Bytes |
Number of transmitted bytes. |
|
Tx Dropped |
Number of transmitted packets that were dropped. |
|
Tx Errors |
Number of packets transmitted incorrectly that has a CRC error and a non-integer number of octets (alignment error) |