Downloading the Debug (and Core Dump) File
You can download the debug file from the device (flash memory) and save it to a folder on your local computer.
The device creates the debug file whenever an exception occurs. Each time the device creates a new debug file, it overwrites the existing file. The debug file is saved as a TAR (Tape ARchive) file (.tar), with the following filename format: debug_<Device Name>_ver_<Firmware Version>_mac_<MAC Address>_<Date>_<Time>. For example, debug_SBC_ver_740-500-966_mac_5b-10-35_13-3-2024_10-52-37.tar.
The debug file contains the following:
|
■
|
Exception information, indicating the specific point in the code where the crash occurred and a list of up to 50 of the most recent SNMP alarms that were raised by the device before it crashed. |
|
■
|
Restart (reset) history, where each restart entry provides the reason of the restart (e.g., triggered by Web interface or was an exception), date and time the restart occurred, and software version of the device. This information appears in the reset-history folder. |
|
■
|
Latest syslog messages that were recorded prior to the crash. |
|
■
|
Core dump file if all of the following conditions are met: |
|
●
|
The device has sufficient memory on its flash memory. |
|
●
|
You have enabled the inclusion of the core dump file in the debug file (see below procedure). |
|
■
|
Information on the Floating and Metering licenses (FloatLicense.lzma and MeterLicense.lzma files, respectively, in the system_logs folder). |
|
■
|
If the device is configured with a Client Defaults ini file, it's included in the debug file in the Device folder (default.ini). |
|
■
|
Configuration Package file (in the Device folder). |
|
■
|
The debug file may include additional application-proprietary debug information. |
|
➢
|
To download debug file: |
|
1.
|
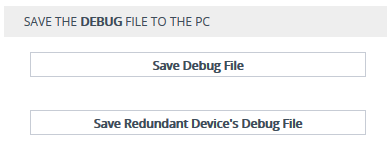
Open the Debug Files page (Troubleshoot menu > Troubleshoot tab > Debug folder > Debug Files), and then scroll down to the 'Save The Debug File To The PC' group: |
|
2.
|
By default, the core dump file is included in the downloaded debug file. If you don't want to include it, clear the 'Attach Core Dump File' check box. |
|
3.
|
Click the Save Debug File button; the device downloads the debug file to a folder on your computer. For devices in HA mode, this button downloads the debug file of the active device. To download the redundant device's debug file, click the Save Redundant Device's Debug File button. |
|
●
|
Downloading the debug file may take a few minutes. Depending on file size, it may even take more than 10 minutes. |
|
●
|
Downloading through SFTP: |
You can also download (Get) the debug file from the device through SFTP. The file is located in the device's /debug folder. Your SFTP client needs to authenticate itself with the SFTP server (i.e., the device). You can access the /debug folder only if you are a Security Administrator user.
For downloading the debug file through SFTP, you need to enable SSH on the device.
The device may take a long time to prepare the debug file for SFTP transfer if it contains much information. Some SFTP clients (for example, WinSCP and FileZilla) have a short default connection timeout and if the file transfer is not started within this timeout, the transfer attempt is aborted. Therefore, it's recommended to configure a longer timeout for your SFTP client application.