Adding Performance Monitoring Graphs to KPI Layouts
Once you have configured a KPI Layout (see Configuring KPI Layouts), you can add graphs to it for the device's performance monitoring parameters. You can add and plot multiple performance monitoring parameters per graph. For example, if you have configured a KPI Layout with a 1x2 layout design (i.e., two graphs, positioned side by side), you can add two performance monitoring parameters to one graph and three performance monitoring parameters to the other graph.
Adding graphs to KPI Layouts offers the following main feature-rich capabilities:
| ■ | Each graph can be configured with customized labels (titles), for example, for the x and y axis. |
| ■ | Each graph can be enabled to display a tooltip showing the values of a specific point on the graph when the mouse hovers over it. |
| ■ | A powerful drill-down selection list allows you to quickly and easily select the required performance monitoring parameter from the device's hierarchical structure of performance monitoring parameters. |
| ■ | Each plotted performance monitoring parameter can be configured with a specific line color on the graph for easy identification. |
The following uses an example of a graph to show the graph's main areas. The example shows a graph containing two plotted performance monitoring parameters, where each has a different color line.
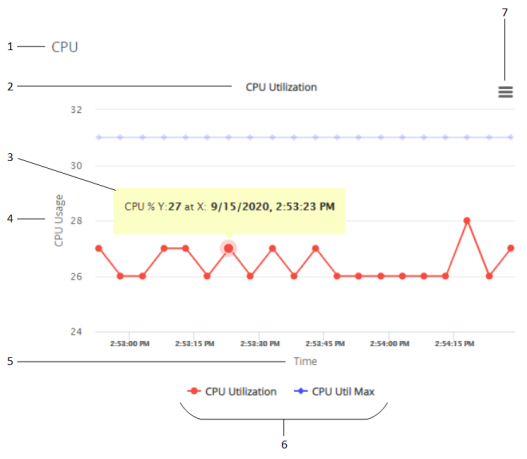
Legend:
| 1. | KPI Layout name |
| 2. | Graph title |
| 3. | Tooltip |
| 4. | Y-axis title |
| 5. | X-axis title |
| 6. | Legend of plotted performance monitoring parameters |
| 7. | Hamburger button with a drop-down menu for adding graphs and for other functionality (discussed later in this chapter) |
| ● | You can plot up to 2,100 performance monitoring parameters in total (all KPI Layouts). |
| ● | If you delete a KPI Layout in the KPI Layouts table, its listing in the Navigation pane under the KPI Layouts > Layouts folder is removed. However, performance monitoring graphs that were added to the deleted KPI Layout are not deleted and can be used in any other KPI Layout. |
| ● | To configure alarm thresholds per performance monitoring parameter, see Configuring Alarm Thresholds for Performance Monitoring. |
The following procedure describes how to configure performance monitoring graphs through the Web interface. You can also configure it through ini file [KPIGraphs] or CLI (configure system > kpi > graphs).
| ➢ | To add performance monitoring graphs to KPI Layout: |
| 1. | In the Navigation pane, select the required KPI Layout name (Monitor menu > Monitor tab > Performance Monitoring folder > KPI Layouts > Layouts); the layout appears, as shown in the following example of a 1x2 graph layout: |
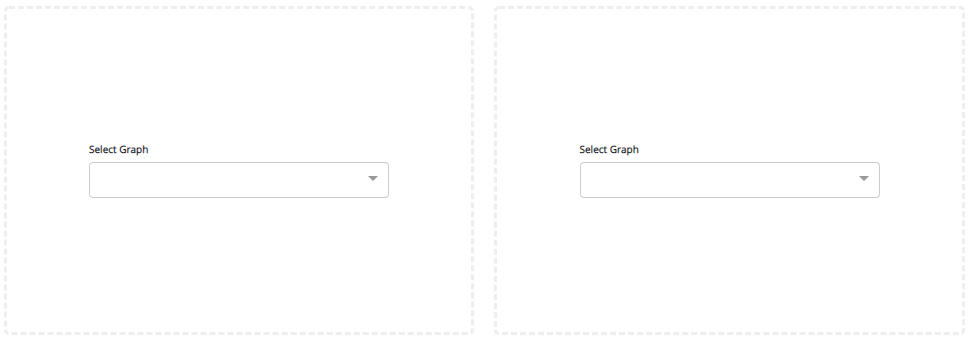
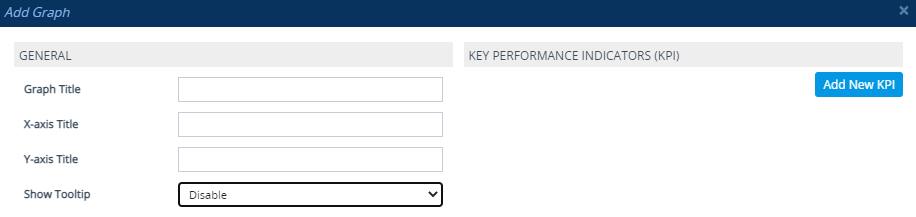
| 2. | In the required graph panel, from the 'Select Graph' drop-down list, click Add New; the following dialog box appears: |
If you have already added performance monitoring parameters to graphs (regardless of KPI Layout), when you click the 'Select Graph' drop-down list, it also displays these performance monitoring parameters, which you can select and add to the graph.
| 3. | Under the General group, configure the general settings for the graph, according to the parameters described in the table below. |
Edit Graph Table Parameter Descriptions
|
Parameter |
Description |
||||||
|---|---|---|---|---|---|---|---|
|
General |
|||||||
|
'Graph Title' graphs-title [KPIGraphs_Title] |
Defines a label (title) for the graph, which is displayed above the graph. Note: The graph's title must be unique. |
||||||
|
'X-axis Title' graphs-xtitle [KPIGraphs_XTitle] |
Defines a label for the graph's x axis, which is displayed horizontally below the x axis. |
||||||
|
'Y-axis Title' graphs-ytitle [KPIGraphs_YTitle] |
Defines a label for the y axis, which is displayed vertically alongside the y axis. |
||||||
|
'Show Tooltip' graphs-tooltip [KPIGraphs_Tooltip] |
Enables a tooltip that appears when you hover your mouse over a point on the plotted line of the graph. The tooltip displays the values of the x and y axis at the specific point.
When enabled, you can also add text to the tooltip that is displayed with the values (see the 'Tooltip Text' parameter below). |
||||||
|
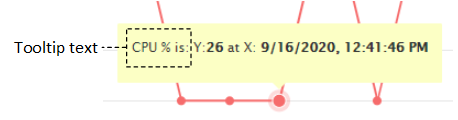
'Tooltip Text' graphs-tooltip-text [KPIGraphs_TooltipText] |
Defines text that is displayed in the tooltip with the plotted values, as shown in the following example:
If you don't configure the parameter, no text is displayed with the values in the tooltip. Note: The parameter is applicable only if you configure the 'Show Tooltip' parameter to Enable. |
||||||
| 4. | For each performance monitoring parameter that you want added to the graph, do the following: |
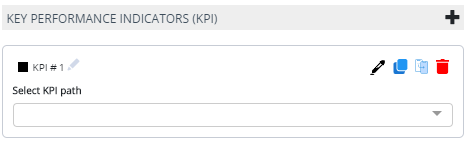
| a. | Click the Add New KPI button; the following appears: |
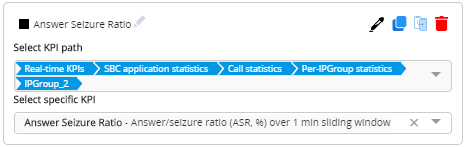
| b. | Use the 'Select KPI path' drop-down list to drill-down the device's hierarchical tree of performance monitoring parameters to select the performance monitoring parameter that you want added to the graph. Selection of the performance monitoring parameter includes the following drill-down stages: |
| i. | The type of performance monitoring parameter - realtime (Real-time KPIs) or historical (Historical KPIs). |
| ii. | The application level to which the performance monitoring parameter belongs (Media, Network, SBC, or System). |
| iii. | The group level within the application to which the performance monitoring parameter belongs. |
| iv. | The element level within the group to which the performance monitoring parameter belongs. |
| v. | The performance monitoring parameter itself. |
For example, the Answer Seizure Ratio performance monitoring parameter is selected as shown below:
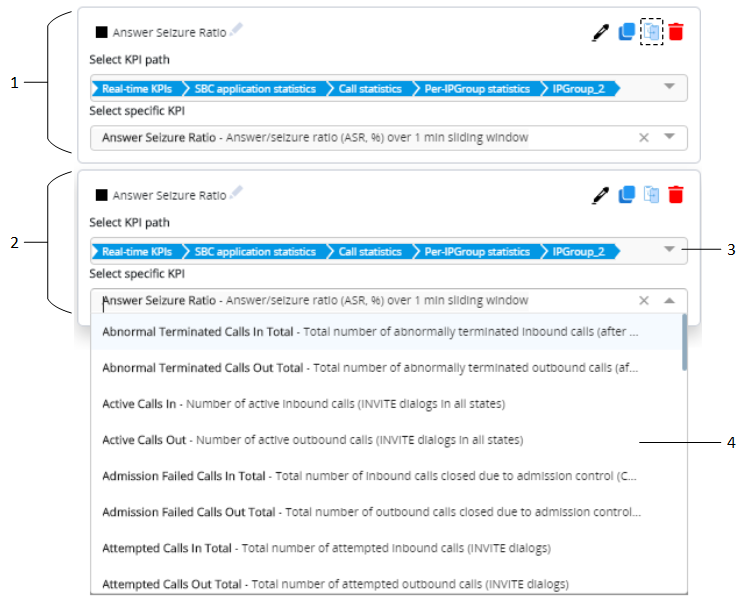
| c. | If you are adding to the graph multiple performance monitoring parameters that are located on the same level (or near by) in the hierarchical tree, instead of drilling all the way down for each parameter, you can simply duplicate the KPI path of an already selected parameter, and then modify the path for the new parameter. To do this: |
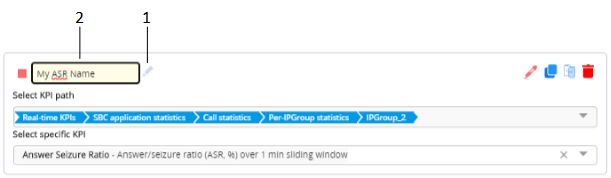
| i. | Click the Duplicate KPI  icon of the already configured KPI path (#1 in figure); the KPI path is duplicated (#2 in figure). icon of the already configured KPI path (#1 in figure); the KPI path is duplicated (#2 in figure). |
| ii. | If you want to select a parameter that is located on the same level as the duplicated KPI path, then from the 'Select specific KPI' drop-down list (#3 in the figure), select the parameter (#4 in the figure), for example: |
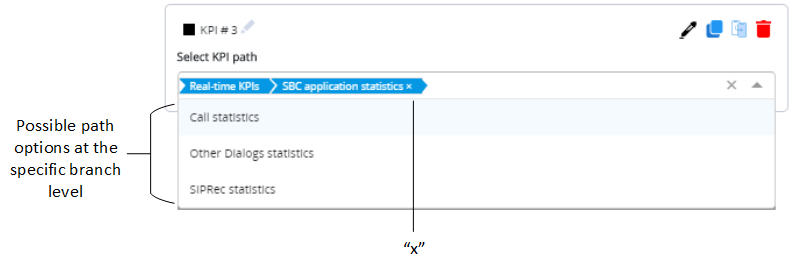
| iii. | If you need to modify the path, in the 'Select specific KPI' field, click the x icon; the selected parameter is removed and an "x" appears at the end of the path in the 'Select KPI path' field, as shown in the following example: |
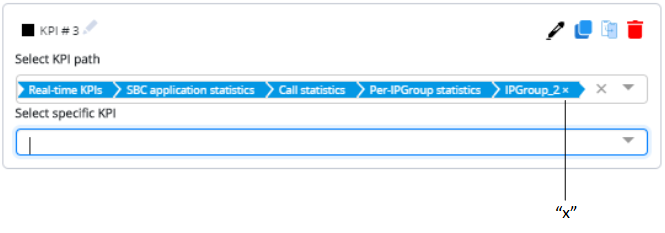
In the 'Select KPI path' field, click the "x" at the end of the path; the lowest level in the hierarchical path is removed and a drop-down list appears, offering all the optional path values of that level. If you need to modify the path from a higher level in the path, keep clicking the "x" at the end of the path until the required level. For example, the below shows the path (compare to previous figure) removed until the application level:
You can copy the path of a selected performance monitoring parameter in REST API format (e.g., /api/v1/kpi/current/sbc/callStats/ipGroup/2/answerSeizureRatio), by clicking the  icon corresponding to the configured performance monitoring parameter. This is useful, for example, when managing the device through REST API (see REST-Based Management) or when searching for the parameter in the Performance Monitoring Parameters Reference Guide. If the path includes an index, as shown in the example (".../ipGroup/2/..."), when searching in the Performance Monitoring Parameters Reference Guide, replace the index number with "<index>" (e.g., /api/v1/kpi/current/sbc/callStats/ipGroup/<index>/answerSeizureRatio).
| 5. | To apply a color to the graph's plotted line of the performance monitoring parameter: |
| a. | Click the color picker  icon; the color palette appears: icon; the color palette appears: |
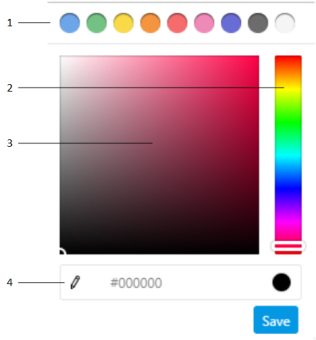
| b. | Choose a line color, by using the main-colors bar (1), color slide (2), color field (3), or the hexadecimal color-code field (4). |
| c. | Click Save. |
| 6. | Each plotted performance monitoring parameter has a default name, which is displayed as a legend below the graph. To modify the name: |
| a. | Click the pencil  icon (1) located next to the added performance monitoring name; the text box becomes available. icon (1) located next to the added performance monitoring name; the text box becomes available. |
| b. | In the text box (2), enter a new name. |
| c. | Click anywhere outside of the text box to apply your settings. |
| 7. | Click Save to save all your graph settings. |