Show a Service
You can display the Service Information for the Live Platform entity.
| ➢ | To display the details: |
| 1. | In the Services page, select the check box adjacent to the service that you wish to view, and then click Show. |

The details of the managed service entity are displayed.
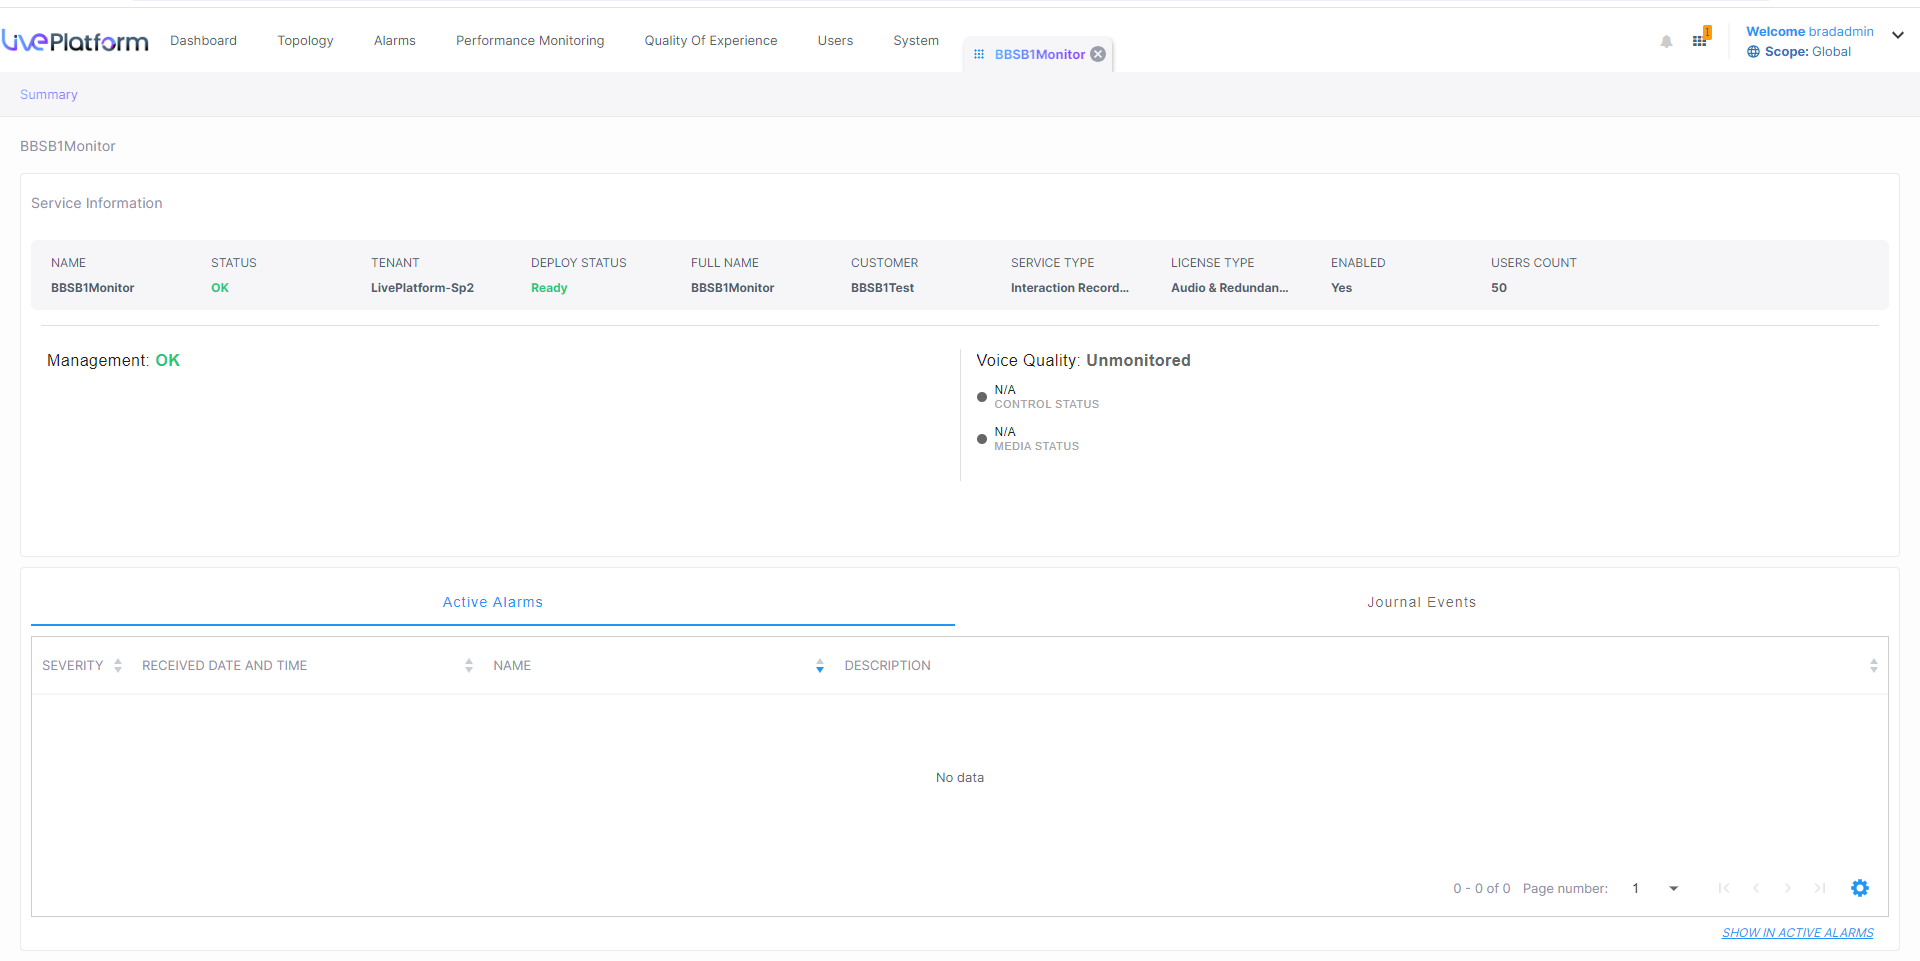
The table below describes the Service Information displayed above.
|
Status Type |
Description |
|||||||||||||||||||||||||||||||||||||||||||||||||||||||||
|---|---|---|---|---|---|---|---|---|---|---|---|---|---|---|---|---|---|---|---|---|---|---|---|---|---|---|---|---|---|---|---|---|---|---|---|---|---|---|---|---|---|---|---|---|---|---|---|---|---|---|---|---|---|---|---|---|---|---|
|
Name |
The name of the service provider, customer or channel. |
|||||||||||||||||||||||||||||||||||||||||||||||||||||||||
|
Status |
The status of the Management entity (see Management Statuses). |
|||||||||||||||||||||||||||||||||||||||||||||||||||||||||
|
Tenant |
The Service Provider tenant name. |
|||||||||||||||||||||||||||||||||||||||||||||||||||||||||
|
Deploy Status |
Deployment status (see Deploy Status and Status Indicators) |
|||||||||||||||||||||||||||||||||||||||||||||||||||||||||
|
Full name |
The full name of the service. |
|||||||||||||||||||||||||||||||||||||||||||||||||||||||||
|
Customer |
The name of the attached customer. |
|||||||||||||||||||||||||||||||||||||||||||||||||||||||||
|
Service Type |
Type of Live Platform Service. One of the following values:
|
|||||||||||||||||||||||||||||||||||||||||||||||||||||||||
|
License Type |
The License type of the service:
|
|||||||||||||||||||||||||||||||||||||||||||||||||||||||||
|
Enabled |
Indicates whether the license is enabled for the managed entity. |
|||||||||||||||||||||||||||||||||||||||||||||||||||||||||
|
Users count |
Counter representing the M365 Tenant voice-enabled users. |
|||||||||||||||||||||||||||||||||||||||||||||||||||||||||
|
Management and QoE Status |
The status of the Management and QoE entities (see Management Statuses). |
|||||||||||||||||||||||||||||||||||||||||||||||||||||||||
|
Active Alarms and Journal Events |
The breakdown of the Active alarms. Click to drill down to the Alarms page (see Monitoring Alarms from Customer Sites). |
The following table describes the Voice Quality metrics monitored in this page. For more information, see Monitoring Voice Quality Statistics from Customer Service Sites.
|
Metric |
Description |
|---|---|
|
Total Calls |
Shows the total number of call streams. |
|
Max Concurrent Streams |
Max Concurrent Calls chart shows the maximum concurrent calls distributed over time. The chart shows when the maximum concurrent calls peaked compared to when they dipped. You can compare this to other charts to identify correlation. Max Concurrent Calls is the maximum number of calls opened at the same time in the server. Note that if you click a bar to open the Calls List page, the number of calls shown in the Calls List page might be different to the number shown in the graph; only calls that end within the time range are displayed in the Calls List page; if a call exceeds the time range, it won't be displayed in the Calls List page. |
|
MOS |
MOS - Mean Opinion Score (specified by ITU-T recommendation P.800) - the average grade on quality scales of Good to Failed, given to voice calls made over a VoIP network at the conclusion of the testing. |
|
Jitter (msec) |
Jitter can result from uneven delays between received voice packets. To space packets evenly, the jitter buffer adds delay. The higher the measurement, the greater the impact of the jitter buffer’s delay on audio quality. Two Jitter values are shown, one value for the caller side and one value for the callee side. |
|
Delay (msec) |
Delay (or latency) - the time it takes for information to travel from source to destination (round-trip time). Sources of delay include voice encoding / decoding, link bandwidth and jitter buffer depth. Two Delay values are shown, one value for the caller side and one value for the callee side. |
|
Packet Loss (%) |
Lost packets - RTP packets that aren’t received by the voice endpoint for processing, resulting in distorted voice transmission. Two Packet Loss % values are shown, one value for the caller side and one value for the callee side. Packet Loss can be greater than 100%. |
|
Successful/Failed Calls |
Successful / Failed Calls chart shows the % and # of calls whose performance was evaluated as successful or failed, distributed over time The chart lets you assess calls performance at a glance. The chart shows when successful calls peaked compared to when failed calls peaked. You can compare this to other charts to identify correlations. Click to drill down to the details of the selected data segment. |
|
Quality Distribution |
Calls Quality chart shows the distribution of voice quality (% and # of calls whose voice quality scored Good Fair or Poor) over time. Gray indicates 'Unknown' voice quality. Point the cursor over a color-coded bar segment in any time period to view this pop-up. The date and time indicates when the period ended. Click to drill down to the details of the selected data segment. |
|
Service Calls |
Shows the details of calls made by users accounts for the service. For more information, see Monitoring Calls from Customer Sites. |