Viewing Alarms and Logs
You can view alarms and detailed logs generated by the Live Platform service for troubleshooting components. You can filter data according to alarm severity, log levels, by alarm and message types and according to Time ranges. The Ask UCAAS AI feature lets you run a query on the alarm or application logs to gather insights on the entry through utilization of an AI agent application.
| ➢ | To view alarms and logs: |
| 1. | Open the Services portal. |
| 2. | In the navigation pane, select Monitoring. |
| 3. | To view alarms: |
| a. | Click the System Alarms tab. |
| b. | From the 'Alarm Source' drop-down list, select one of the following: |
| ❖ | Active Alarms to view currently active alarms. |
| ❖ | History Alarms to view historical active alarms. |
| a. | (Optional) Filter the alarms list by severity level, type (alarm or event), or source. |
| 4. | To view logs: |
| a. | Click the Application Logs tab. |
| b. | (Optional) Filter the logs list by type, log level, time range, and message. |
The following figure displays an example of Active System alarms:
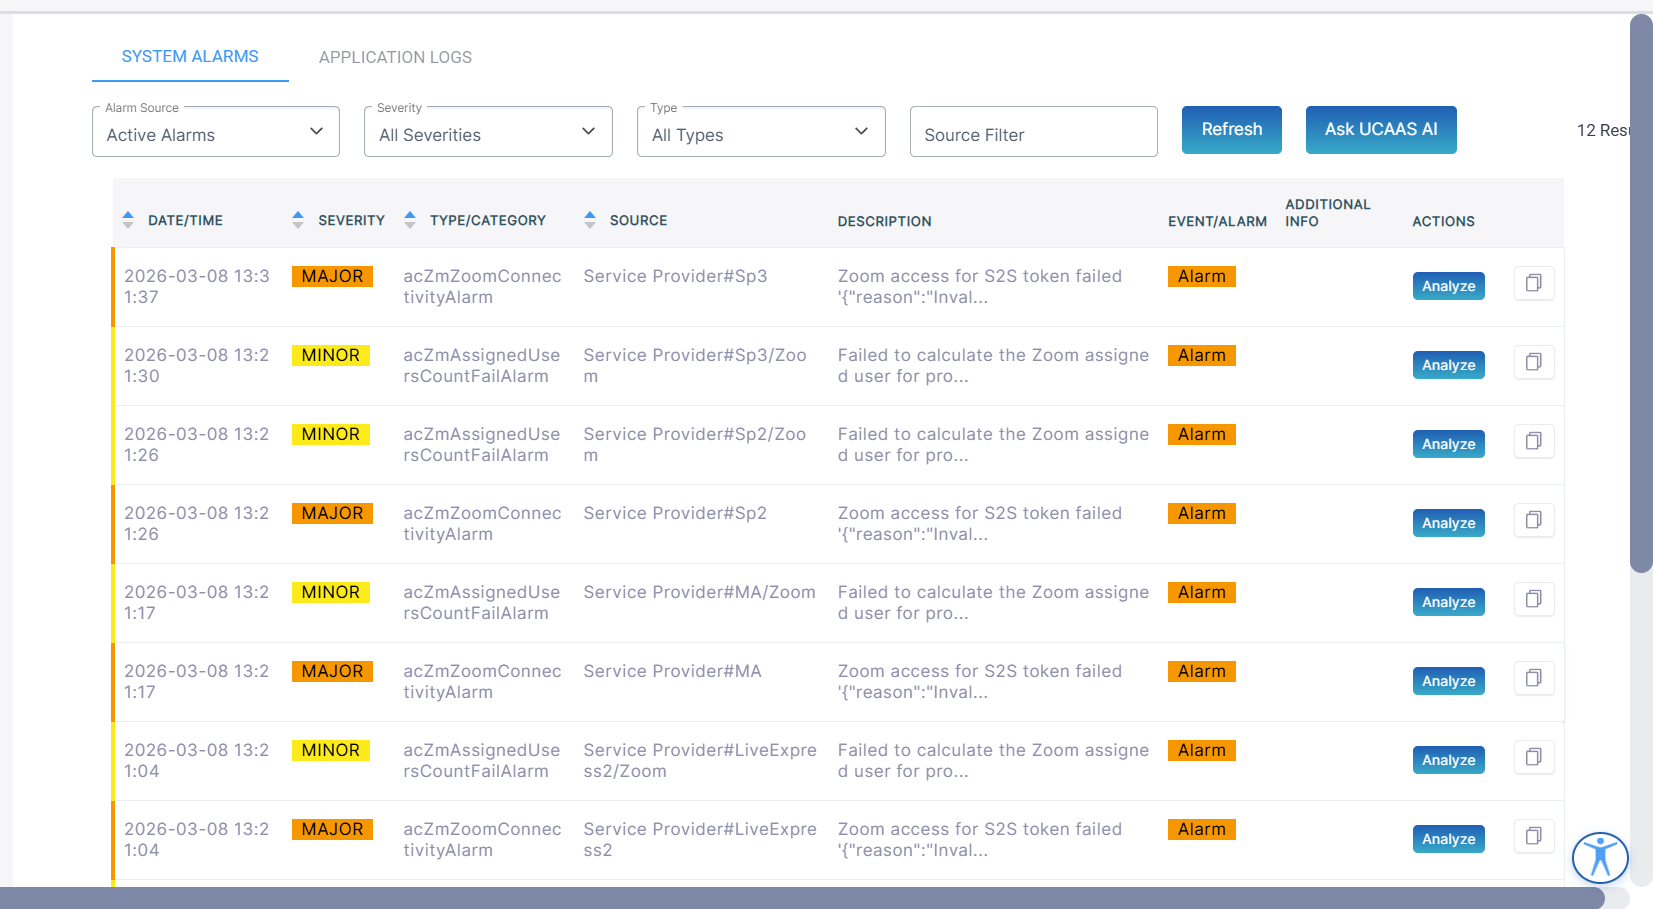
The table below describes the fields on this page.
|
Field |
Description |
||||||||||||||||||
|---|---|---|---|---|---|---|---|---|---|---|---|---|---|---|---|---|---|---|---|
| Date and time |
Date and time when the alarm was raised. In the following: YYYY-MM-DD HH:MM:SS |
||||||||||||||||||
|
Severity |
Alarm severity:
|
||||||||||||||||||
|
Type/Category |
Alarm MIB name |
||||||||||||||||||
|
Source |
Service Provider#<serviceprovidername>/ProvidersInfo |
||||||||||||||||||
|
Description |
Description of the alarm issue. |
||||||||||||||||||
|
Event/Alarm |
Indicates whether an alarm or an event. |
||||||||||||||||||
|
Additional Info |
Additional info for the alarm if relevant. |
||||||||||||||||||
|
Analyze Actions |
Click Analyze option to automatically generate an AI query for the alarm. |
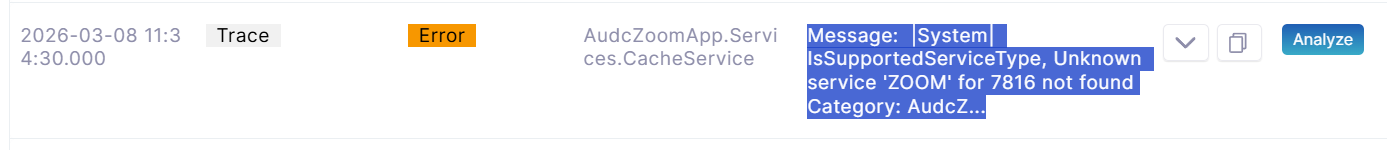
The following figure displays an example of Application logs traces:
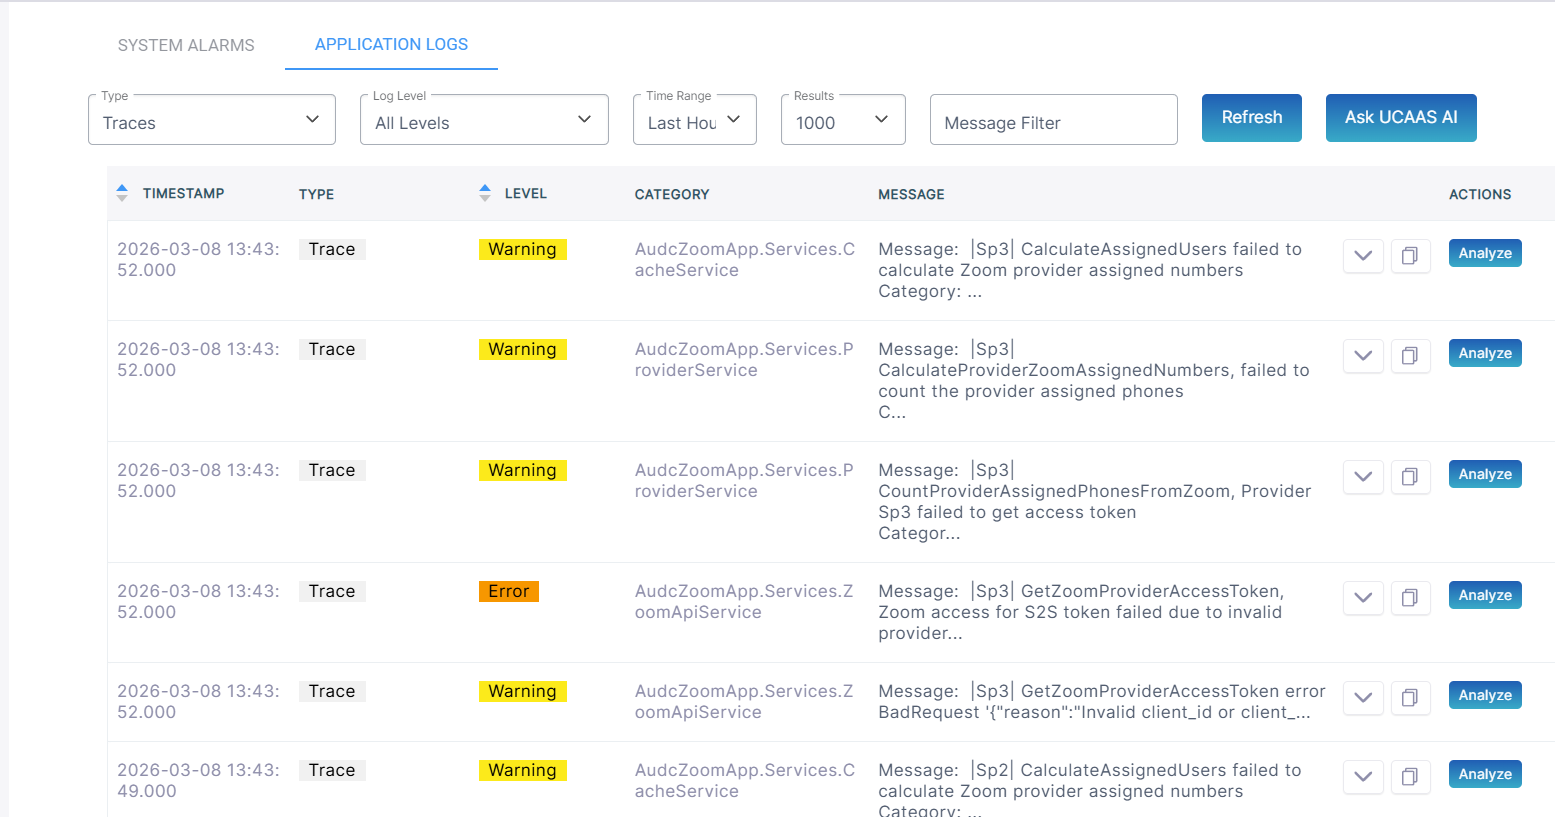
| 5. | Click the arrow key adjacent to the entry to view the full message text. |
The table below describes the fields on this page.
|
Field |
Description |
|||||||||||||||
|---|---|---|---|---|---|---|---|---|---|---|---|---|---|---|---|---|
| Timestamp |
Date and time when the alarm was raised. In the following: YYYY-MM-DD HH:MM:SS From the drop-down filter, select the relevant time range. |
|||||||||||||||
|
Results |
From the drop-down filter, select the number of log entries to retrieve. |
|||||||||||||||
|
Type |
From the drop-down filter, select the message type:
|
|||||||||||||||
|
Level |
From the drop-down filter, select the Log level:
|
|||||||||||||||
|
Category |
The UCaaS server service component |
|||||||||||||||
|
Description |
Description of the alarm issue. |
|||||||||||||||
|
Message |
Log message text description. |
|||||||||||||||
|
Analyze Actions |
Click Analyze option to automatically generate an AI query for the message. The Ask UCAAS AI prompt box is displayed; click Submit to run the query. |
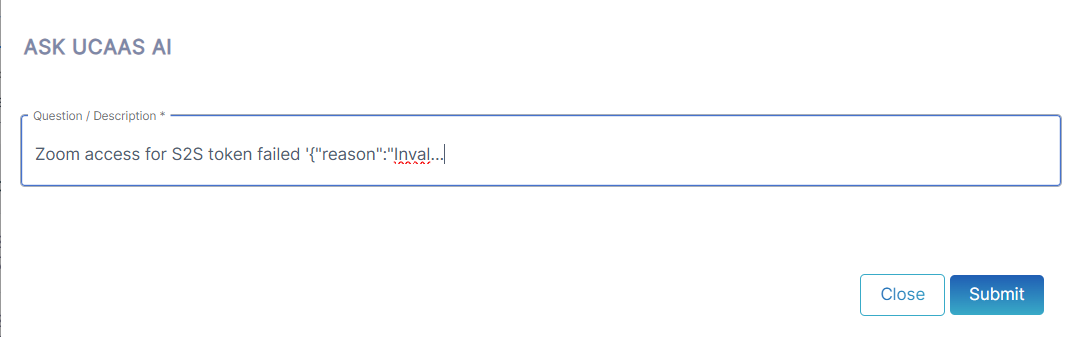
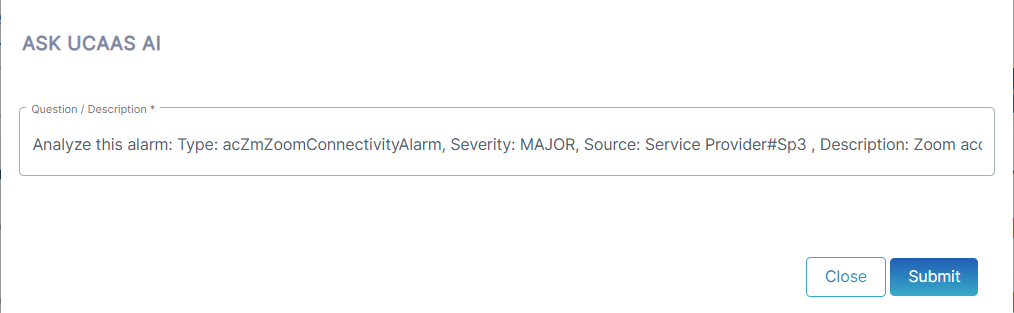
| 6. | Query the Ask AI interface using the following methods: |
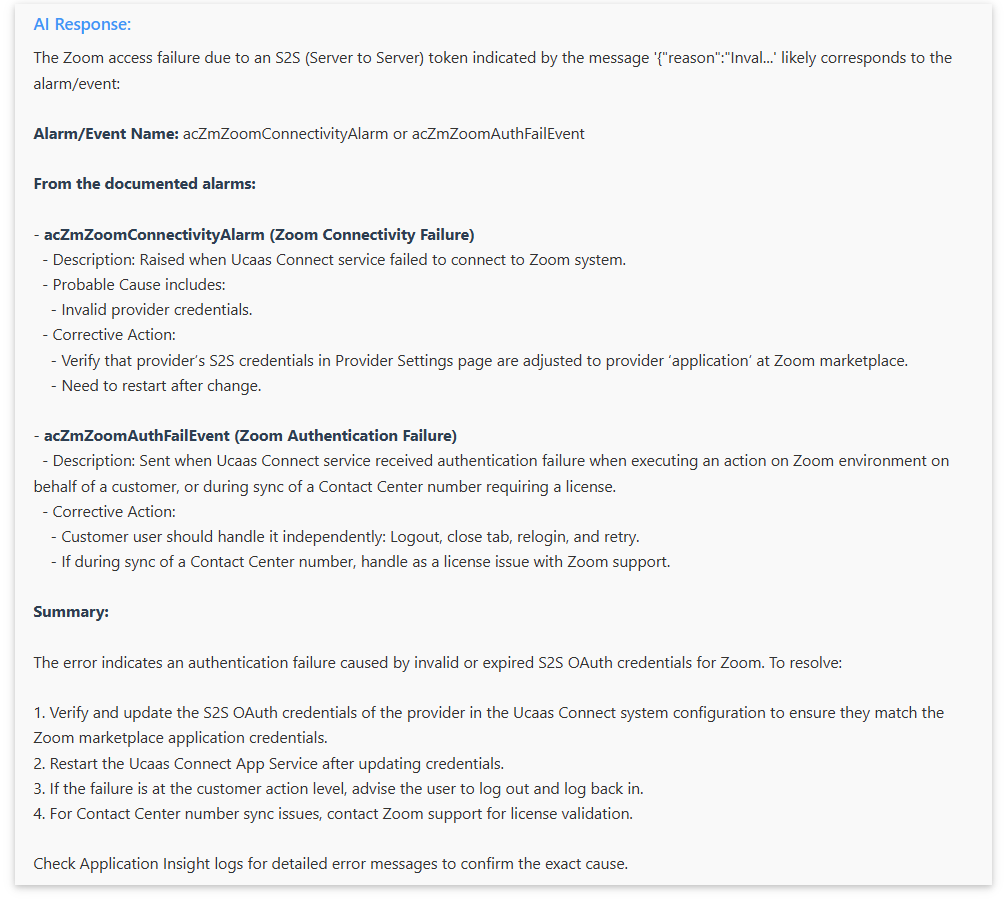
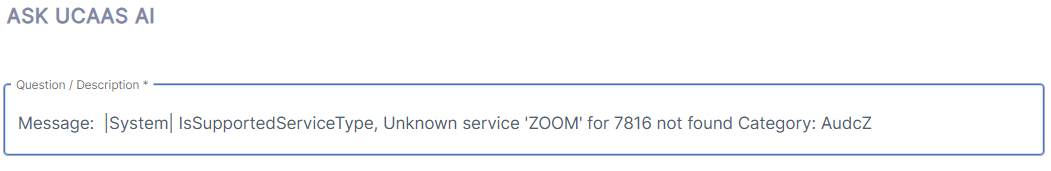
| ● | Click Ask UCAAS AI to run a query on the alarm details. In the Question/Description field, enter the query text string and then click Submit. |

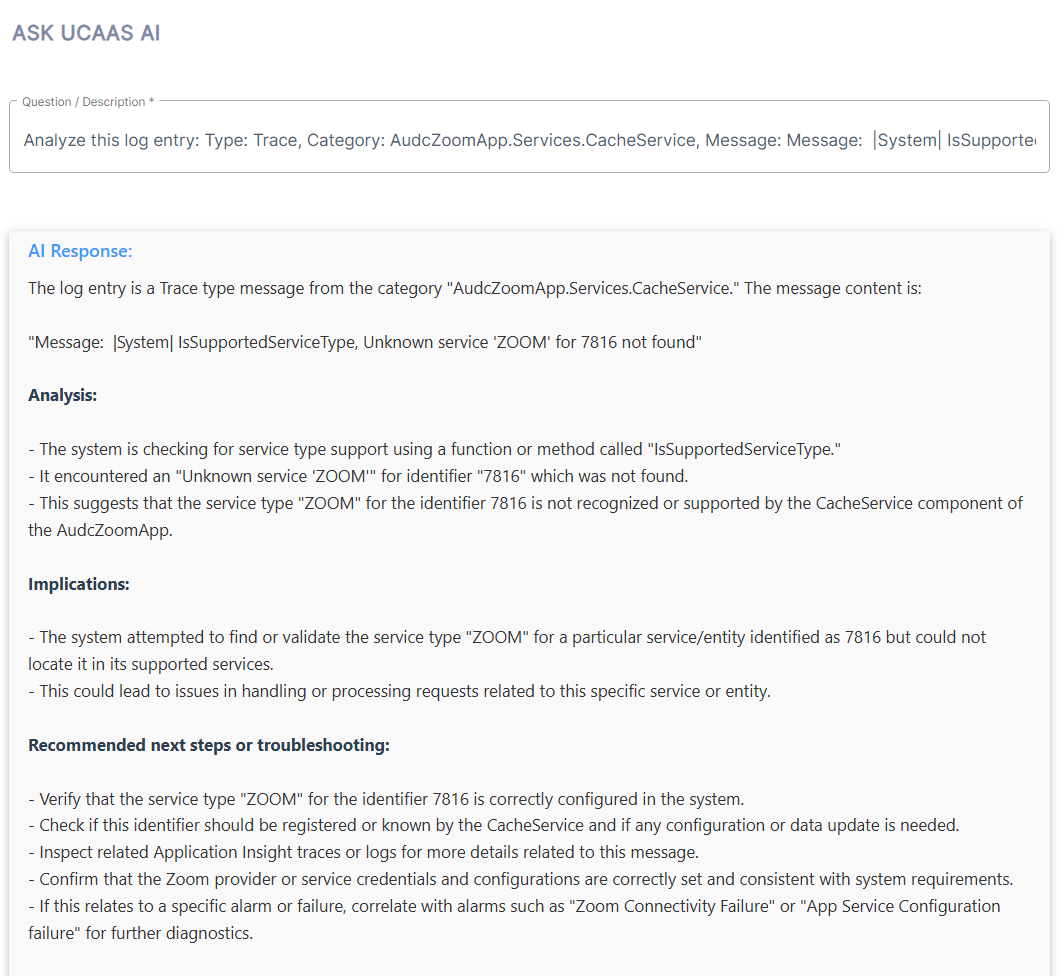
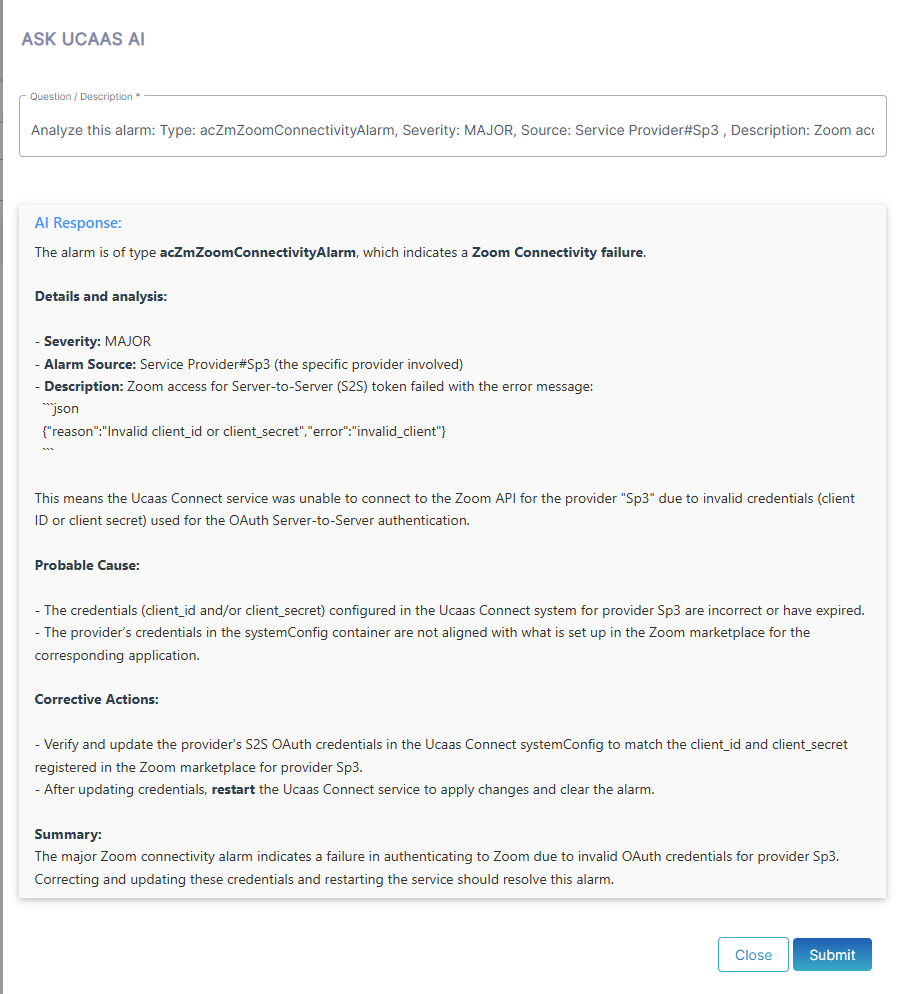
The Ask AI interface generates a response.
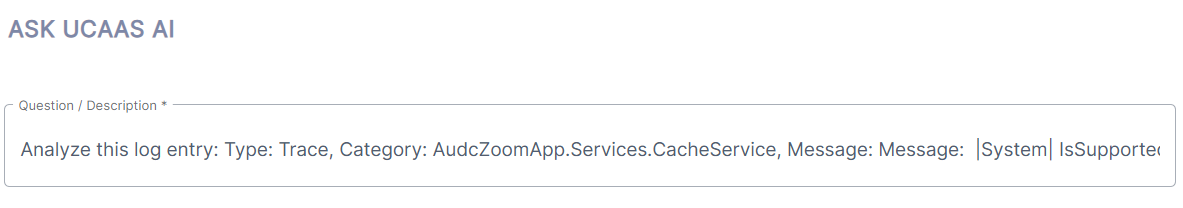
| ● | Click the Analyze button for the entry that you wish to ask AI to analyze. The Question/Description field is displayed and automatically filled with query text based on the log entry. |
| ● | You can run similar queries in the Application Logs tab view. |
The Ask AI interface generates a response.